


Keywords: Oil sands; Hepatocytes; Oncorhynchus mykiss; Biotransformation; Genotoxicity; Endocrine Disruption; Oxidative Stress; Cytotoxicity
The toxicity of OSPW to aquatic organisms has received increasing attention over the last decade. Toxicity has been examined at various levels, including endocrine disruption, DNA damage, immune competence, biotransformation and reproduction. Goldfish exposed to OSPW for 12 weeks showed elevated expression of pro inflammatorygenes such as interleukin- 1β and tumor necrosis factor 2 in the spleen and kidneys [9]. Thisled to decreased ability of head kidney macrophages to produce reactive oxygen species, which normally follows phagocytosis of bacteria. In a study with fathead minnows exposed to OSPW, lower plasma 11-ketotestosterone levels and gonado-somatic indices were observed [10]. There were also signs of epithelium degeneration in gills of fish exposed to OSPW compared to reference fish, supporting the notion that the toxicity of OSPW is diverse and not specific to a target organ. This was corroborated by another study, which examined the health status of white suckers exposed to aged OS tailings [11]. Fish maintained in aged OSPW had smaller testes and ovaries and reduced growth, which resulted from limited available energy and endocrine disruption, which was associated with increased CYP1A1 activity in the liver. The first evidence of endocrine disruption based on the Vitellogenin (VTG) pathway was reported by Gagné, at al. [12]. VTG gene expression was induced in trout hepatocytes exposed to surface waters located upstream and downstream from the OS development area as well as to OSPW. Induction was higher in cells exposed to OSPW compared to surface waters, which suggests that OSPW is estrogenic. In a previous study, however, it was found that sea water leachates from oil rigs did not increase mosquito fish plasma VTG [13]. OPSW was shown to be genotoxic to rainbow trout hepatocytes based on the alkaline DNA precipitation and comet assays [14,15]. In addition to OSPW and NA commercial mixtures, DNA damaging compounds were ubiquitous in both upstream and downstream surface waters, which suggest that a number of chemicals contributed to the observed genotoxicity of OS. The multi-drug ATP binding cassette transporter (MDR) was also influenced by OS-related compounds and is involved to the efflux of potentially toxic hydrocarbons from cells. The effects of the soluble fraction of OSPW on MDR transport activity were examined in Japanese medaka fry [16]. It was found that the neutral and basic fractions of OSPW inhibited the extrusion of calcein dye in fry, which suggests that MDR activity could be inhibited and limit the elimination of organic contaminants in fish exposed to OS in the environment. These fractions were shown to contain higher levels of oxygen-, sulfur-, and nitrogen-containing hydrocarbons. This study corroborated earlier findings that MDR gene expression was inhibited in hepatocytes exposed to OSPW but not by OS leachates [17]. A better understanding of OSPW-specific toxic effects from the natural leaching of OS compounds would provide more information on the fundamental ecotoxicological impacts of industrial extraction in the Athabasca watershed. Recent evidence suggests that OSPW is more toxic than passive OS water leachates in the river. For example, a study of the phytotoxicity of laboratory-prepared OSPW and of OS leachates revealed that OSPW contained more light PAHs (naphthalene-like), vanadium, aluminum and chromium than did OS leachates [18]. A study compared the toxic properties of OSPW and OS leachates using primary cultures of rainbow trout hepatocytes [17]. It found that some gene transcripts were more specific to OSPW and either did not respond or respond slightly to OS leachates; these were superoxide dismutase (SOD), glutathione S-transferase (GST), CYP3A4, glyceraldehyde-3-phosphate dehydrogenase, a marker of anaerobic glycolysis, and two genes involved in DNA repair (GADD45 and APEX). DNA repair genes responded to OSleachates, albeit less strongly than they did to OSPW. Moreover, gene transcripts that were associated with cell viability were chosen on the basis of their implication in cell mortality. It was found that genes involved in biotransformation were closely related to cytotoxicity. Although these genes appeared to be specific to OSPW but not to OS leachate, they were not compared with selected NAs or commercial NA mixtures to identify similarities with OSPW and determine whether surface waters upstream and downstream from the OS mining area display similar toxic properties to OSPW and NAs.
The purpose of the study was to compare the response profiles of gene transcripts in rainbow trout hepatocytes exposed to a selection of individual NA-like compounds of increasing molecular size (z value), commercial mixtures of NA, OSPW and surface water samples collected in locations upstream and downstream from the OS mining area. We hypothesized that the upstream and downstream waters are similar (no influence from mining activities) and that OPSW cannot be explained only by NAs or commercial NA mixtures (null hypothesis). The gene transcripts were chosen based on the results of previous studies on OSPW, OS leachates and surface water. Cytotoxicity was examined at the membrane integrity level in addition to biotransformation, oxidative stress, genotoxicity (DNA repair), anaerobic glycolysis, endocrine disruption (estrogenicity) and cell maintenance/growth. Primary cultures of fish hepatocytes are recognized models for toxicity investigations involving biotransformation [19]. An attempt was made to find common trends in gene expression profiles for OSPW, individual NAs, commercial mixtures of NAs and downstream surface waters in the Athabasca River in a region where industrial OS extraction operations are carried out.
OSPW and surface water samples were collected in the Athabasca River near the OS extraction sites. OSPW samples 1 and 2 correspond to two different OS tailing ponds. The surface waters consisted of samples from the upstream site (in the Athabasca River, 10 km downstream from Fort McMurray) and the OS area (along the western shore of the Athabasca

Primers were designed using NCBI’s Primer-BLAST (Primer3 with Blast) and Net Primer (Bio soft, Palo Alto, CA) to avoid secondary structures. The selected primer sequences were then synthesized by Integrated DNA Technologies (Coralville, Iowa, USA) and reported in Table 3. The qPCR reactions were performed using the iQ SYBR Green Super Mix (Bio-Rad, Mississauga, On, Canada) and a real-time thermocycler (Master cycler ep realplex2; Eppendorf). All reactions were run in duplicate and consisted of 5 uL of cDNA (equivalent to 20 ng cDNA), 12.5 μL of iQ SYBR Green Super Mix, 0.2 mM of each dNTP, 25 U/mL of iTaq DNA polymerase, 3 mM of MgCl2, and 10 nM of SYBR Green I, primer concentrations of 300 nM each, and DEPC-treated water (Ambion), and were completed to 25μL. Temperature cycleswere 95°C for 2 min, then 40 cycles at 95°C for 15 s, 60°C for 15 s, and 68°C for 15 s. A melting curve analysis was performed to check for lack of amplification specificity; the temperatures used were 95°C for 15 s, lowered to 57°C and increased to 95°C after 10 min.
Target genes |
Symbol |
Function/role |
APEX nuclease (multifunctional DNA repair enzyme) |
APEX |
Genotoxicity, DNA repair |
Catalase |
CAT |
Oxidative stress, hydrolysis of H2O2 |
Cytochrome P450 1A |
CYP1A |
Biotranformation, hydroxylation of coplanar polycyclic aromatic compounds |
Cytochrome P450 3A |
CYP3A |
Biotransformation, hydroxylation of polycyclic aliphatic hydrocarbons |
Estradiol receptor β2 |
ER |
Endocrine disruption, estrogen receptor |
growth arrest and DNA-damage-inducible, alpha |
GADD45 |
Genotoxicity, DNA repair activity |
Glyceraldehyde 3P dehydrogenase |
GAPDH |
Anaerobic glycolysis |
Glutathion-S-Transferase-P |
GST |
Biotransformation, conjugation of polar hydrocarbons |
DNA ligase |
Ligase |
Genotoxicity, DNA repair activity |
8-oxoguanine DNA glycosylase |
OGG |
Genotoxicity and oxidative stress, DNE repair of oxidized nucleotides (8-oxoguanine) |
Proliferating cell nuclear antigen |
PCNA |
Cell division |
P-glycoprotein (Abcb1) |
pGP |
Phase III « biotransformation », involved in the extrusion of polar hydrocarbons |
Superoxide dismutase (Cu/Zn cytosolic) |
SOD |
Oxidative stress, oxygen radicals transfer for H2O2 genesis |
uracil-DNA glycosylase |
UNG |
Genotoxicity, DNA repair activity. |
Vitellogenin |
Vtg |
Endocrine disruption, egg yolk protein precursor under the control of the estrogen receptor |
Reference genes |
|
|
Prolylpeptidyl isomerase I |
PPIA |
Significantly affected, not selected for normalization |
Hypoxanthine phosphoribosyl transferase I |
HPRT |
Significantly affected, not selected for normalization |
RNA polymerase I |
RPL |
Significantly affected but fairly. Could be used for normalization |
Elongation factor I α |
EFIα |
Least significantly affected, used for normalization |
The toxicity of the individual compounds, NA mixtures, OSPW and surface waters were investigated in rainbow trout hepatocytes (Figures 1A-1F). Toxicity was determined by loss of membrane permeability (try pan blue staining) and totals RNA levels were used as a general indicator of cell activity. With regard to the individual compounds, z = 0 and z = 2 were the most toxic compounds based on cell viability (Figure 1A). Interestingly, the z = 0 and z = 2 compounds were more toxic than the equivalent amount of both NA commercial mixtures. Based on total RNA levels, all compounds significantly influenced RNA levels but in a different manner (Figure 1B). Compounds z = 0 to z=6 increased total RNA levels at the lowest concentration (2 mg/ L) compared with a decrease in RNA levels at concentrations > 10 mg/ L. However, compounds z = 8 to z = 10 and the 2 commercial mixtures of NAs decreased total RNA levels at all concentrations tested. The toxicity of 2 OSPW samples was assessed; they were similarly toxic as they both increased cell mortality at a concentration of 0.5% (Figure 1C). This corresponds to the original concentration of 50% given that a 100× concentrate of the water/OSPW extract was used. At the total RNA level, the two samples both increased RNA levels at the lowest concentration (0.4% of original concentration) with a decreasing effect as the concentration reached 50% dilution (Figure 1D). This suggests that acute lethality is likely to occur at low OSPW dilutions, while changes in total RNA levels can be detected at 0.4%. Exposure to surface water extracts did not produce any appreciable changes in cell viability (Figure 1E). Total RNA levels were generally increased at 0.02% (or 2% of the original sample) with a trend of stronger responses for downstream sites in the OS area (i.e., decreased levels of total RNA) but with increased total RNA levels for the confluence of Ells River site. Correlation analysis between cell viability and RNA levels revealed that total RNA levels were significantly correlated with cell viability (r = 0.53; p < 0.001).
Gene expression was investigated in hepatocytes exposed to individual compounds, NA mixtures, OSPW and surface water extracts (Table 4). The individual NA compounds from z = 0 to z = 10 and the 2 commercial NA mixtures affected gene expression levels for the 15 target genes (Table 4). Xenobiotic biotransformation genes were generally up regulated but were down regulated with GST for all NAs (z = 0 to z = 10). CYP3A4 gene expression, which is involved in the biotransformation of cyclic aliphatic compounds, was down regulated for the z = 10 compound. The biggest changes (based on the fold response/ concentration ratio) were observed with CYP1A1 for the z = 10 compound and commercial NA mixture 1, CYP3A4 for z = 2 and 4 compounds, GST for z = 6 and 10 compounds and MDR for z = 10 compound. Gene expression involved in oxidative stress
Target genes |
Symbol |
Foward primer |
Reverse primer |
Amplicon size (bp) |
APEX nuclease (multifunctional DNA repair enzyme) |
APEX |
TGACAACGGCACAGCTCCCG |
GGCCTCGTCACGCACCCAAT |
199 |
Catalase |
CAT |
TGATGTCACACAGGTGCGTA |
GTGGGCTCAGTGTTGTTGAG |
195 |
Cytochrome P450 1A |
CYP1A |
GATGTCAGTGGCAGCTTTGA |
TCCTGGTCATCATGGCTGTA |
104 |
Cytochrome P450 3A |
CYP3A |
TACATGCCATTTGGGGCGGGG |
ACGGGCCTCCAGCCTCAGTTT |
195 |
Estradiol receptor β2 |
ER |
CTGACCCCAGAACAGCTGATC |
TCGGCCAGGTTGGTAAGTG |
125 |
growth arrest and DNA-damage-inducible, alpha |
GADD45 |
CGAGGCAGCCAAGTCGCTCA |
CTCGCAGCAGAACGCCTGGA |
130 |
Glyceraldehyde 3P dehydrogenase |
GAPDH |
CCAACCAAACGCTACCGAAC |
CCAGATTCCATCTCACCTT |
173 |
Glutathion-S-Transferase-P |
GST |
ATTTTGGGACGGGCTGACA |
CCTGGTGCTCTGCTCCAGTT |
81 |
DNA ligase |
Ligase |
TGGTGCGATTTTGAAGTGTG |
GGTCCTGTGTCCTTGTGGTT |
147 |
8-oxoguanine DNA glycosylase |
OGG |
GGCGGGCAATGGGCAGAAGA |
CCGAGTGTGCCCAACCAGCA |
101 |
proliferating cell nuclear antigen |
PCNA |
ACAACGCAGACACACTCGCCC |
GGGCAAACTCCCCCGATGGC |
156 |
P-glycoprotein (Abcb1) |
pGP |
ACGTGCGCTCCCTGAACGTG |
GCGTTGGCCTCCCTAGCAGC |
157 |
Superoxyde dismutase (Cu/Zn cytosolic) |
SOD |
TGGTCCTGTGAAGCTGATTG |
TTGTCAGCTCCTGCAGTCAC |
201 |
uracil-DNA glycosylase |
UNG |
TGTCTACCCACCCCCTCAGCA |
CCGTGATATGGGTCCTGGCCG |
96 |
Vitellogenin |
Vtg |
AGCCCATCCACGAACTTGCTGTT |
AGGGCCAAAACTGCATCAGCCT |
190 |
Reference genes |
|
|||
Elongation factor I α |
EFIα |
GAATCGGCTATGCCTGGTGAC |
GGATGATGACCTGAGCGGTG |
141 |
RNA polymerase I |
RPL |
ACTATGGCTGTCGAGAAGGTGCT |
TGTACTCGAACAGTCGTGGGTCA |
120 |
Prolylpeptidyl isomerase I |
PPIA |
CATCCCAGGTTTCATGTGC |
CCGTTCAGCCAGTCAGTGTT |
203 |
Hypoxanthine phosphoribosyl transferase I |
HPRT |
CCGCCTCAAGAGCTACTGTAAT |
GTCTGGAACCTCAAACCCTATG |
255 |
|
pH (units) |
Conductivity (µs/ cm)
|
Suspended matter (mg/ L) |
DOC (mg/ L) |
Light PAHs (phenanthrene) |
Total PAHs |
Light/total |
Upstream |
8.8
|
291.6 |
10.4 |
4 |
159 |
350 |
47% |
OS development area |
8.8 |
280.3 |
20.9 |
12 |
217 |
473 |
47% |
OSPW |
9 |
2200 |
360 |
55 |
3300 |
4600 |
72% |
Muskeg River confluence |
8.7 |
413.7 |
16.3 |
8 |
125 |
375 |
33% |
Ells River confluence |
8.6 |
268.8 |
23.1 |
7 |
208 |
411 |
51% |
NA Mix 1 |
--- |
--- |
--- |
|
6724 |
7371 |
91% |
NA Mix 2 |
--- |
--- |
--- |
|
1483 |
2043 |
72% |

The effect of OSPW and surface water extracts collected upstream and downstream from the OS development area on gene expression was also determined (Table 5). Genes involved in biotransformation were up regulated in most cases, with the exception of GST gene expression, which was always down regulated. The upstream site, located in a high density area of OS deposits(10 km north of Fort McMurray),did not produce changes in all tested genes involved in biotransformation. CYP1A1 gene expression was significantly induced for one of the 2 OSPW samples and somewhat down regulated in the OS extraction
Gene category |
Gene id |
z=0 |
z=2 |
z=4 |
z=6 |
z=8 |
z=10 |
NA Mix 1 Mix 2 |
Xenobiotic biotransformation |
CYP1A1 |
1.7 (10 mg/L) 1 |
ns2 |
1.9 (50 mg/L) |
1.5 (2 mg/L) |
ns |
3.4 (2 mg/L) |
2.8 (2 mg/L) 1.5 (2 mg/L) |
|
CYP3A4 |
1.6 (10 mg/L) |
2 (2 mg/L) |
1.7 (2 mg/L) |
1.3 (2 mg/L) 0.65 |
1.4 (2 mg/L) |
0.56 (2 mg/L) |
1.9 (2 mg/L) 1.6 (2 mg/L) |
|
GST |
0.45 (10 mg/L) |
0.8 (2 mg/L) |
0.7 (2 mg/L) |
0.48 (2 mg/L) |
0.5 (10 mg/L) |
0.44 (2 mg/L) |
ns ns |
|
PGP (MDR) |
3 (10 mg/L)0.3 |
4 (10 mg/L) |
1.8 (50 mg/L) |
1.3 (50 mg/L) |
4.4 (10 mg/L) |
7 (2 mg/L) |
1.5 (2 mg/L) 1.7 (10 mg/L) |
Oxidative stress |
SOD |
2.2 (50 mg/L) |
ns |
ns |
1.4 (2 mg/L) |
ns |
1.5 (10 mg/L) |
1.3 (2 mg/L) ns |
|
CAT |
1.5 (50 mg/L) |
0.5 (2 mg/L) |
0.6 (50 mg/L) |
0.75(10 mg/L) |
1.7 (2 mg/L) |
1.9 (2 mg/L) |
1.7 (2 mg/L) 1.2 (2 mg/L) |
|
OGG |
0.5 (50 mg/L) |
1.4 (2 mg/L) |
1.4 (2 mg/L) |
1.5 (2 mg/L) |
1.4 (2 mg/L) |
ns |
2.2 (2 mg/L) 1.9 (2 mg/L) |
Genotoxicity |
UNG |
0.7 (2 mg/L) |
0.45(10 mg/L) |
1.4 (2 mg/L) |
ns |
1.5 (2 mg/L) |
0.7 (10 mg/L) |
1.6 (2 mg/L) 2 (10 mg/L) |
|
APEX |
1.8 (10 mg/L) |
1.7 (10 mg/L) |
2 (10 mg/L) |
2 (2 mg/L) |
2.7 (10 mg/L) |
1.3 (2 mg/L) |
3.4 (2 mg/L) 3.2 (2 mg/L) |
|
Ligase |
1.6 (10 mg/L) |
1.6 (2 mg/L) |
1.5 (2 mg/L) |
1.5 (2 mg/L) |
1.7 (2 mg/L) |
ns |
2.2 (2 mg/L) 2 (2 mg/L) |
|
GADD45 |
2 (10 mg/L) |
1.7 (10 mg/L) |
ns |
2.2 (50 mg/L) |
2.4 (10 mg/L) |
2 (2 mg/L) |
2.4 (2 mg/L) 1.7 (10 mg/L) |
Estrogenicity |
ER2 |
0.4 (2 mg/L)3 |
ns |
1.8 (10 mg/L) |
0.1 (2 mg/L) |
2 (10 mg/L) |
1.4 (10 mg/L) |
1.9 (2 mg/L) ns |
|
VTG |
0.4 (2 mg/L) |
4.8 (10 mg/L) |
ns |
1.7 (50 mg/L) |
1.7 (10 mg/L) |
ns |
3.6 (10 mg/L) 1.9 (10 mg/L) |
Other |
GADPH |
1.3 (50 mg/L) |
1.3 (10 mg/L) |
1.6 (10 mg/L) |
0.58 (10 mg/L) |
1.5 (2 mg/L) |
2.6 (2 mg/L) |
1.8 (2 mg/L) 1.4 (2 mg/L) |
|
PCNA |
0.4 (2 mg/L) |
0.5 (2 mg/L) |
0.6 (2 mg/L) |
0.6 (2 mg/L) |
0.66 (2 mg/L) |
ns |
1.3 (2 mg/L) ns |
2. Ns: not significant
3. The 3 most sensitive endpoints are highlighted in bold. The endpoints are calculated based on the ratio of the fold change/concentration in mg/L.
Gene category |
Gene ID |
OSPW1 OSPW2 |
OS area |
Muskeg River confluence |
Ells River confluence |
Upstream |
Xenobiotic biotransformation |
CYP1A1 |
ns 1.5(0.02%) |
0.7(0.1%) |
ns |
ns |
ns |
|
CYP3A4 |
1.8 (0.004%) 1.5(0.02%) |
ns |
ns |
1.3(0.02%) |
ns |
|
GST |
ns 0.6 (0.1%) |
ns |
0.65(0.02%) |
0.7(0.1%) |
ns |
|
PGP (MDR) |
1.6 (0.1%) 2.1(0.02%) |
ns |
1.5(0.02%) |
1.3(0.1%) |
ns |
Oxidative stress |
SOD |
0.7(0.004%) 1.2(0.02%) |
ns |
ns |
ns |
ns |
|
CAT |
1.4 (0.1%) ns |
ns |
1.6 (0.02%) |
1.6(0.02%) |
2(0.1%) |
|
OGG |
1.6 (0.004%) 1.5(0.004%) |
1.4(0.02%) |
1.5(0.02%) |
1.6(0.02%) |
1.9(0.1%) |
Genotoxicity |
UNG |
1.5 (0.004%) 1.7(0.02%) |
1.7 (0.02%) |
1.8(0.1%) |
1.2(0.1%)12 |
ns |
|
APEX |
2.1 (0.004%) 2.5 (0.004%) |
ns |
1.7(0.02%) |
2.2(0.02%) |
1.6(0.02%) |
|
Ligase |
2.8 (0.004%) 1.4 (0.004%) |
1.2(0.02%) |
1.4(0.02%) |
1.5(0.02%) |
ns |
|
GADD45 |
ns 0.8 (0.004%) |
0.6(0.1%) |
ns |
0.7(0.1%) |
0.7(0.02%) |
Estrogenicity |
ER2 |
ns 1.6 (0.02%) |
2(0.02%) |
1.6(0.02%) |
1.3(0.1%) |
ns |
|
VTG |
ns 18(0.1%) |
ns |
ns |
ns |
ns |
Other |
GADPH |
1.47 (0.004%) 1.5 (0.02%) |
1.9(0.1%) |
1.3(0.02%) |
1.3(0.02%) |
1.4(0.1%) |
|
PCNA |
1.2 (0.02%) 1.5 (0.02%) |
ns |
ns |
1.2(0.1%) |
ns |
relative to the controls; the concentration is in parentheses. 2. Ns: not significant
3. The 3 most sensitive endpoints are highlighted in bold. The endpoints are calculated based on the ratio of the fold change/concentration in % v/v.
A classification and regression tree (CART) analysis was performed on the gene expression and Cytotoxicity data to get an global view about the cytotoxic properties of individual compounds, commercial NA mixtures, OSPW and surface water samples towards rainbow trout hepatocytes (Figure 3). The analysis revealed 4 distinct clusters based on a number of properties (rules) related to gene expression and Cytotoxicity data. The first cluster consists of the control and upstream surface water extracts, which were classified based on the following rules or observations: no/low cell mortality and LIG gene expression levels at first, followed by UNG levels > 1.1 and GADD45 levels < 0.7, then the sample belongs to the second sub-cluster, and is still considered upstream; however, if GADD45 is > 0.7, the sample is now considered downstream water. Downstream waters are characterized by increased expression of DNA repair genes such as UNG, GADD45, and LIG. When LIG gene expression reaches > 1.7 fold, the sample belongs to the next (third) cluster, which contains NA mixtures 1 and 2. NA mixtures are characterized by high LIG gene expression levels ( > 1.7 fold). OSPW 1 and 2 are found in the 4th cluster, which is characterized by high Cytotoxicity ( > 1.3 fold relative to the controls). OSPW samples are characterized by high levels of CYP1A1 and PCNA gene expression for OSPW1. OSPW2 is characterized by increased CYP3A4 expression and low GST values (at least > 0.6). The individual NAs were distributed within the fourth cluster (OSPW), with the exception of z=8, which was located in the third NA mixture cluster. No clear pattern of gene expression was found for the individual NAs, but marked changes in CYP1A1 (> 2.8 fold) and CYP3A4 (> 2 fold) and GADD45 (> 1.1 fold) were found for z = 10, z = 2 and z = 8 compounds. The most important biomarkers (< 80% relative importance) permitting classification of the various samples were PCNA, CYP3A4, GADD45, LIG and CYP1A1. These biomarkers were strongly associated with Cytotoxicity responses, with the exception of PCNA.
Decision tree analysis was performed using the CART algorithm (univariate) to identify the divisions with the best performance. The decision tree and rules for each division are shown in A and the most important biomarkers for sample classification are shown in B. The dashed line in figure 3B represents the 75% threshold.
OPSW Genotoxicity was found in the present study based on the observation that the most marked responses in DNA repair genes were obtained with the two OSPW samples. To the best of our knowledge, [14] were the first to report DNA damage in a study on rainbow trout hepatocytes exposed to OSPW extracts and surface waters. DNA strand breaks in primary cultures of trout hepatocytes exposed to surface waters and OSPW extracts were found to be the most responsive endpoint; however, they offered the least discrimination between “natural” or background levels in the area rich in OS deposits and the area downstream from OS mining activity. This highlights the challenge involved in discriminating between natural releases of OS contaminants and those associated with mining activities in the region. Moreover, marked DNA repair gene expression was also observed for both upstream and downstream surface waters, with a trend of higher responses for the area downstream from the OS mining operations. This is consistent with the relatively high background values of PAHs found in the area rich in OS deposits [5,13]. PAHs are known to induce CYP1A1 gene expression and produce DNA damage [22]. High molecular weight (heavy) PAHs were found to be responsible for most of the mutagenic activity. The comet assay was used in rainbow trout hepatocytes to examine the contribution of some NAs (including commercial mixtures), OSPW and OS leachates in terms of mimicking the natural background release of genotoxic compounds [15]. Genotoxicity was observed in all samples from the individual compounds (z = 6 to z = 10), commercial NAs, OSPW and OS leachates. However, genotoxic potential was higher for OSPW than for the OS leachates and it was strongly involved oxidative DNA damage. A recent study revealed that diamondoid naphthenic acids caused in vivo DNA damage in the hemocytes and gills of marine mussels [23]. This is keeping with our results and those of the Lacaze, et al. [15] study in which a noradamantane carboxylic acid increased the expression of APEX, LIG and GADD45 genes. Interestingly, the noradamantane carboxylic acid (z = 6) also induced the expression of OGG (DNA repair of oxidized guanine) at lower intensities (1.5 fold at 2 mg/ L) than for LIG and APEX, which produced 2-fold (2 mg/ L) and 2.2-fold (50 mg/ L) responses, respectively. This was also found with the comet assay on trout hepatocytes at much lower concentrations (0.2 mg/ L) in the Lacaze, et al. study[15].
Recent evidence suggests that some OS products are capable of inducing VTG gene expression in rainbow trout [12]. To the best of our knowledge, this was the first report VTG gene upregulation in trout hepatocytes exposed to OSPW and to surface waters from the OS development area.VTG gene expression was markedly increased in one of the OSPW samples with a response 18 times greater than for the controls. There was no indication of induction in hepatocytes exposed to surface waters. ER2 gene expression was increased for surface waters from sites downstream from the OS development area and for one of the OSPW extracts. As in the case of Genotoxicity responses, these data suggest that endocrine disrupting substances are present in OSPW and in river water in the area with rich OS deposits; however, the intensity of responses seems to vary from year to year. The commercial NA mixtures also induced VTG and ER2 gene expression, further supporting the hypothesis that OSPW-related materialis estrogenic to fish. In a previous study, VTG gene expression increased about 30-fold when hepatocytes were exposed to OPSW, whereas surface waters were 2X less potent in inducing VTG (i.e., 15-fold increase relative to controls).Exposure to NAs isolated from OSPW and to commercial NA mixtures significantly increased the production of progesterone and estradiol-17β but decreased testosterone levels in H295R cells [24]. This corroborates the present study’s findings of increased CYP3A4 gene expression caused by OSPW and commercial NAs mixtures. Indeed, CYP3A4 codes for the corresponding cytochrome P450, which has 6β-testosterone hydroxylase activity and is involved in the elimination of testosterone [25].In another study with young-of-the-year zebra fish (Danio rerio), exposures to NAs in OSPW and commercial NA mixtures led to the upregulation of aromatase (CYP19b), Erα and VTG gene expression [26]. These changes in gene expression were associated with delays in embryo hatching, which was followed by developmental lesions such as pericardial edema, yolk sac edema and spinal malformation. These results further support the notion that NAs derived from OS can negatively impact endocrine function in fish and can contribute to long-term toxicity of OSPW. Aromatic NAs were found to weakly induce VTG gene expression in zebra fish larvae [27], suggesting that other types of NAs or other compounds found in OSPW contribute towards estrogenicity or produce effects at the steroid metabolism level, as shown above. It appears that NA endocrine-disrupting effects occur across the brain–gonad–liver axis in fathead minnows exposed to untreated and ozone treated OSPW [28]. The abundances of transcripts of estrogen-responsive genes were greater in livers from male fish exposed to untreated OSPW compared to control male fish. However, the opposite effect was found in female fish, which showed a decrease in estrogen-responsive genes in the liver. The same pattern was observed for the gonads. By contrast, in brain tissue, the abundance of transcripts of genes important for synthesis of gonadotropins was greater in both male and female fish exposed to OSPW than in control fish. These results indicate that the endocrine-disrupting effect goes beyond the liver and affects the entire brain–gonad–liver axis.
The reported toxicity of the individual organic compounds in this study is limited to aquatic species. Chemical characterization of commercial NAs revealed that the majority of NAs in commercial mixtures were composed of 1 to 3 rings [29]. These commercial preparations also contain monoaromatic acids and non-acids (both found in the light PAHs fraction), PAHs and sulfur heterocyclic hydrocarbons. Abietic acid (z = 10) was found not to influence VTG gene expression, although a small increase in ER2 gene expression is observed at a relatively high concentration of 10 mg/ L. It was found that abietic acid in combination with estrogenic compounds contributed to male feminization of the roach [30]. This suggests that some NAs could potentiate the effect of environmental estrogens. Abietic acid was found to cause inhibition in GST gene expression. GST inhibition was also observed in mussels exposed to 3 μM (0.9 mg/ L) of abietic acid for up to 24 h [31]. DNA integrity and oxidative stress in mussel hepatopancreas were respectively decreased and increased in exposed mussels, a finding that parallels thepresent study’s 2-fold increase in GADD45 gene expression with increases in SOD and CAT, which is indicative of oxidative stress responses. The Genotoxicity and biotransformation potential of abietic acid was investigated in the eel Anguilla anguilla L [32,33]. Low concentrations of abietic acid (0.1 to 0.3 mM) were found to increase EROD activity (CYP1A1) in eels, which is in line with the observed induction in gene expression of CYP1A1 (3.4 fold relative to the controls). Abietic acid also increased erythrocyte nuclear abnormalities and DNA strands in the liver of exposedeels. Thee resin acid, abietic acid, which originates from the decomposition of plants/trees, may be present in bitumen but it also occurs naturally in the environment, as well as in municipal and pulp mill effluent wastewaters; hence, it is not considered specific to OSPW.
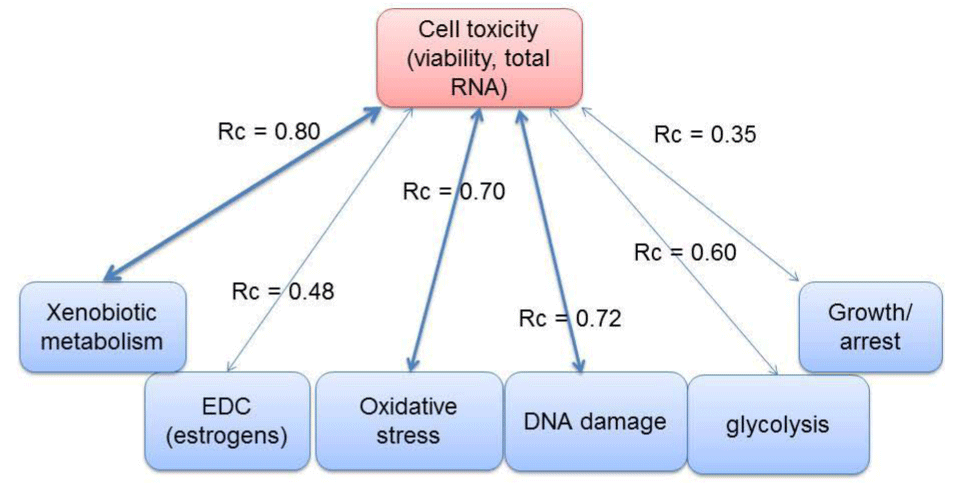
In this study, based on canonical analysis, the genes involved in Xenobiotic biotransformation, oxidative stress and DNA repair activity were strongly related to Cytotoxicity. Exposure to OSPW was shown to alter gene expression of male fathead minnows involved in oxidative stress, oxidative metabolism (which involves biotransformation), apoptosis and immune function [34].In another study, fathead minnow embryos exposed to OSPW hatched prematurely and the embryos exhibited higher incidences of hemorrhage, pericardial edema and malformation of the spine [35]. These embryos had elevated reactive oxygen species with a greater abundance of transcripts for CYP3A, GST, SOD and caspase 9. This suggests that OSPW caused oxidative stress and biotransformation of Xenobiotic s which can lead to mitochondrial dysfunction and apoptosis. Hepatocytes exposed to commercial NA mixtures and OSPW had elevated levels of GAPDH, which is involved in anaerobic glycolysis. This could be a consequence of altered mitochondria in the liver due to increased levels of oxidative stress and biotransformation. It is noteworthy that this marker gene was equally expressed in surface waters downstream from the OS extraction area and at the upstream site, suggesting that OS-rich deposits may contain chemicals that affect the aerobic/ anaerobic balance in cells. However, based on canonical analysis, this endpoint was not as strongly correlated to Cytotoxicity compared to the other gene endpoints, indicating that this effect may not be a major driver of toxicity. Nonetheless, this also raises the possibility that disturbance in aerobic/ anaerobic glycolysis could be a contributing factor to the toxicity of OSPW and NAs.
In conclusion, exposure of rainbow trout hepatocytes to OSrelated products revealed various effects at the gene expression level, including biotransformation, oxidative stress, DNA repair activity, anaerobic glycolysis and growth arrest. It was found that genes involved in biotransformation, oxidative stress and DNA damage (repair) were the most strongly associated (rc ≥ 0.70; p < 0.001) with Cytotoxicity based on cell viability and total RNA levels. Decision tree analysis revealed that upstream waters, downstream waters, commercial NA mixtures and OSPW formed 4 distinct groups based on gene expression data. Some trends related to location upstream/downstream from the OS development area were observed, especially with genes involvedin DNA repair (UNG, APEX and LIG) and biotransformation (GST downward expression). Expression of endocrine-disrupting genes was not associated with cell toxicity, VTG was strongly induced by only one of the OSPW samples, and ER2 was expressed in downstream waters. These results collectively suggest that endocrine disruption is not a major effect of exposure to OS-derived products. However, more research is required to determine whether these upstream/downstream trends result from the particular hydrodynamics (confluence of many rivers at downstream sites such as Muskeg and Ells rivers) and mining activities that characterize this region.
- Gosselin P, Hrudey SE, Naeth A, Plourde A, Therrien R, Van Der Kraak G, et al. Environmental and health impacts of Canada's oil sands industry. The Royal Society of Canada/LaSociété Royale du Canada, Ottawa. 2010.
- Frank RA, Roy JW, Bickerton G, Rowland SJ, Headley JV, Scarlett AG, et al. Profiling oilsands mixtures from industrial developments and natural groundwaters for source identification. Environ Sci Technol. 2014;48(5):2660-70. doi: 10.1021/es500131k.
- Bauer AE, Frank RA, Headley JV, Peru KM, Hewitt LM, Dixon DG. Enhanced characterization of oilsands acid-extractable organics fractions using electrospray ionization-high-resolution mass spectrometry and synchronous fluorescence spectroscopy. Environ.Toxicol.Chem. 2015;34(5):1001-1008. doi: 10.1002/etc.2896.
- Puttaswamy N, Liber K. Influence of inorganic anions on metals release from oil sands coke and on toxicity of nickel and vanadium to Ceriodaphniadubia. Chemosphere. 2012;86(5):521-9. doi: 10.1016/j.chemosphere.2011.10.018.
- Kelly EN, Short JW, Schindler DW, Hodson PV, Ma M, Kwan AK, et al. Oil sands development contributes polycyclic aromatic compounds to the Athabasca River and its tributaries. Proc Natl Acad Sci U S A. 2009;106(52):22346-51. doi: 10.1073/pnas.0912050106.
- Kelly EN, Short JW, Schindler DW, Hodson PV, Ma M, Kwan AK, et al. Oil sands development contributes elements toxic at low concentrations to the Athabasca River and its tributaries. Proc Natl Acad Sci U S A. 2009;106(52):22346-51. doi: 10.1073/pnas.0912050106.
- Martin JW, Han X, Peru KM, Headley JV. Comparison of high- and low-resolution electrospray ionization mass spectrometry for the analysis of naphthenic acid mixtures in oil sands process water. Rapid Commun Mass Spectrom. 2008;22(12):1919-24. doi: 10.1002/rcm.3570.
- Holowenko FM, MacKinnon MD, Fedorak PM. Characterization of naphthenic acids in oil sands wastewaters by gas chromatography-mass spectrometry. Water Res. 2002;36(11):2843-55.
- Hagen MO, Katzenback BA, Islam MD, Gamal El-Din M, Belosevic M.The analysis of goldfish (Carassiusauratus L.) innate immune responses after acute and subchronic exposures to oilsands process-affected water. Toxicol Sci. 2014;138(1):59-68. doi: 10.1093/toxsci/kft272.
- Kavanagh RJ, Frank RA, Solomon KR, Van Der Kraak G. Reproductive and health assessment of fathead minnows (Pimephalespromelas) inhabiting a pond containing oilsands process-affected water. Aquat Toxicol. 2013;130-131:201-9. doi: 10.1016/j.aquatox.2013.01.007.
- Arens CJ, Hogan NS, Kavanagh RJ, Mercer AG, Kraak GJ, van den Heuvel MR. Sublethal effects of aged oilsands-affected water on white sucker (Catostomuscommersonii). Environ Toxicol Chem. 2015;34(3):589-99. doi: 10.1002/etc.2845.
- Gagné F, Douville M, André C, Debenest T, Talbot A, Sherry J, et al. Differential changes in gene expression in rainbow trout hepatocytes exposed to extracts of oil sands process-affected water and the Athabasca River. Comp Biochem Physiol C Toxicol Pharmacol. 2012;155(4):551-9. doi: 10.1016/j.cbpc.2012.01.004.
- Casini S, Marsili L, Fossi MC, Mori G, Bucalossi D, Porcelloni S, et al. Use of biomarkers to investigate toxicological effects of produced water treated with conventional and innovative methods. Mar Environ Res. 2006;62 Suppl:S347-51. doi: 10.1016/j.marenvres.2006.04.060.
- Gagné F, André C, Douville M, Talbot A, Parrott J, McMaster M, et al. An examination of the toxic properties of water extracts in the vicinity of an oil sand extraction site. J Environ Monit. 2011;13(11):3075-86. doi: 10.1039/c1em10591d.
- Lacaze E, Devaux A, Bruneau A, Bony S, Sherry J, Gagné F. Genotoxic potential of several naphthenic acids and a synthetic oil sands process affected water in rainbow trout (Oncorhynchus mykiss). Aquat Toxicol. 2014;152:291-9. doi: 10.1016/j.aquatox.2014.04.019.
- Alharbi HA, Saunders DM, Al-Mousa A, Alcorn J, Pereira AS, Martin JW, et al. Inhibition of ABC transport proteins by oilsands process affected water. Aquat Toxicol. 2016;170:81-8. doi: 10.1016/j.aquatox.2015.11.013.
- Gagné F, André C, Turcotte P, Gagnon C, Sherry J, Talbot A. A comparative toxicogenomic investigation of oil sand water and processed water in rainbow trout hepatocytes. Arch Environ Contam Toxicol. 2013;65(2):309-23. doi: 10.1007/s00244-013-9888-2.
- Debenest T, Turcotte P, Gagné F, Gagnon C, Blaise C. Ecotoxicological impacts of effluents generated by oil sands bitumen extraction and oil sands lixiviation on Pseudokirchneriellasubcapitata. Aquat Toxicol. 2012;112-113:83-91. doi: 10.1016/j.aquatox.2012.01.021.
- Baksi SM, Frazier JM. Isolated fish hepatocytes—Model systems for toxicology research. Aquat.Toxicol. 1990;16(4):229–256.
- Klaunig JE, Ruch RJ, Goldblatt PJ. Trout hepatocyte culture: Isolation and primary culture. In Vitro Cell Dev Biol. 1985;21(4):221-8.
- Andersen CL, Jensen JL, Ørntoft TF. Normalization of real-time quantitative reverse transcription-PCR data: a model-based variance estimation approach to identify genes suited for normalization, applied to bladder and colon cancer data sets. Cancer Res. 2004;64(15):5245-50. doi: 10.1158/0008-5472.CAN-04-0496.
- Marvin CH, Lundrigan JA, McCarry BE, Bryant DW. Determination and genotoxicity of high molecular mass polycyclic aromatic hydrocarbons isolated from coal-tar-contaminated sediment. Environ. Toxicol. Chem. 1995;14(12):2059-2066.
- Dissanayake A, Scarlett AG, Jha AN. Diamondoid naphthenic acids cause in vivo genetic damage in gills and haemocytes of marine mussels. Environ Sci Pollut Res Int. 2016;23(7):7060-6. doi: 10.1007/s11356-016-6268-2.
- Wang J, Cao X, Sun J, Huang Y, Tang X. Disruption of endocrine function in H295R cell in vitro and in zebrafish in vivo by naphthenic acids. J Hazard Mater. 2015;299:1-9. doi: 10.1016/j.jhazmat.2015.06.004.
- Yamazaki H, Shimada T. Progesterone and testosterone hydroxylation by cytochromes P450 2C19, 2C9, and 3A4 in human liver microsomes. Arch Biochem Biophys. 1997;346(1):161-9. doi: 10.1006/abbi.1997.0302.
- Wang J, Cao X, Huang Y, Tang X. Developmental toxicity and endocrine disruption of naphthenic acids on the early life stage of zebrafish (Danio rerio). J Appl Toxicol. 2015;35(12):1493-501. doi: 10.1002/jat.3166.
- Reinardy HC1, Scarlett AG, Henry TB, West CE, Hewitt LM, Frank RA, et al. Aromatic naphthenic acids in oil sands process-affected water, resolved by GCxGC-MS, only weakly induce the gene for vitellogenin production in zebrafish (Danio rerio) larvae. Environ Sci Technol. 2013;47(12):6614-20. doi: 10.1021/es304799m.
- He Y, Wiseman SB, Wang N, Perez-Estrada LA, El-Din MG, Martin JW, et al. Transcriptional responses of the brain-gonad-liver axis of fathead minnows exposed to untreated and ozone-treated oil sands process-affected water. Environ Sci Technol. 2012;46(17):9701-8. doi: 10.1021/es3019258.
- Swigert JP, Lee C, Wong DC, White R, Scarlett AG, West CE, et al. Aquatic hazard assessment of a commercial sample of naphthenic acids. Chemosphere. 2015;124:1-9. doi: 10.1016/j.chemosphere.2014.10.052.
- Lange A, Sebire M, Rostkowski P, Mizutani T, Miyagawa S, Iguchi T, et al. Environmental chemicals active as human antiandrogens do not activate a stickleback androgen receptor but enhance a feminising effect of oestrogen in roach. Aquat Toxicol. 2015;168:48-59. doi: 10.1016/j.aquatox.2015.09.014.
- Gravato C, Oliveira M, Santos MA. Oxidative stress and genotoxic responses to resin acids in Mediterranean mussels. Ecotoxicol Environ Saf. 2005;61(2):221-9. doi: 10.1016/j.ecoenv.2004.12.017.
- Maria VL, Correia AC, Santos MA. Anguilla anguilla L. genotoxic and liver biotransformation responses to abietic acid exposure. Ecotoxicol Environ Saf. 2004;58(2):202-10. doi: 10.1016/j.ecoenv.2003.12.005.
- Pacheco M, Santos MA. Induction of EROD activity and genotoxic effects by polycyclic aromatic hydrocarbons and resin acids on the juvenile eel (Anguilla anguilla L.). Ecotoxicol Environ Saf. 1997;38(3):252-9. doi: 10.1006/eesa.1997.1585.
- Wiseman SB, He Y, Gamal-El Din M, Martin JW, Jones PD, Hecker M, et al. Transcriptional responses of male fathead minnows exposed to oil sands process-affected water. Comp Biochem Physiol C Toxicol Pharmacol. 2013;157(2):227-35. doi: 10.1016/j.cbpc.2012.12.002.
- He Y, Patterson S, Wang N, Hecker M, Martin JW, El-Din MG, et al. Toxicity of untreated and ozone-treated oil sands process-affected water (OSPW) to early life stages of the fathead minnow (Pimephales promelas). Water Res. 2012;46(19):6359-68. doi: 10.1016/j.watres.2012.09.004.

