


1Department of Statistics, College of Natural Science, Seoul National University, Seoul, 151-747, Korea
Background: The determinants of MCVP for shock patients has not been derived explicitly.
Material & methods: The current study has included113 shock patients containing 20 characters. The data site is: http://www. umass.edu/statdata/statdata/data/shock.txt Statistical analysis has been done by joint generalized linear models (JGLMs).
Results: From the mean model of MCVP, it is found that MCVP is positively associated with survival status (SURVIVE) (P=0.0009), mean arterial pressure (MAP) (P< 0.0001), body surface index (BSI) (P=0.0001), mean circulation time (MCT) (P< 0.0001), plasma volume index (PVI) (P=0.0333), while it is negatively associated with diastolic blood pressure (DBP) (P< 0.0001), appearance time (AP) (P=0.0016), urinary output (UO) (P=0.0120). Variance of MCVP is negatively associated with BSI (P=0.0024), MCT (P=0.0236), red cell index (RCI) (P=0.0183), and it is positively associated with UO (P=0.0316), PVI (P=0.1228), hemoglobin (HG) (P=0.0008).
Conclusion: The report concludes that MCVP increases as MAP, or BSI, or MCT, or PVI increases, or DBP, or AP, or UO decreases. These information is a new addition in medical literature.
Keywords: Blood biochemical parameters; Cardiac index; Mean arterial pressure; Mean central venous pressure; Plasma volume index; Joint generalized linear models (JGLMs)
CVP is an indicator of right ventricular and, to a lesser extent, left ventricular preload. It also shows the limit to venous return and reflects about right ventricular function [9, 10]. It measurements may be necessary to guide fluid management. However, it is also influenced by thoracic, abdominal, and pericardial pressures, which makes its prediction more complicated. As a result, the CVP measured does not reflect always the true loading conditions of the right ventricle. It represents the back pressure of all extra thoracic organs and the limit to venous return. Specifically, the risk of renal, ascites, peripheral edema, and liver impairment is associated with the absolute CVP value [11, 12].
Generally, CVP has very complex association with vascular system and cardiac outputs which is difficult to interpret [13, 14]. In veterinary and human clinical practice, CVP is mostly applied to obtain information regarding intravascular volume and cardiac function [15, 16], but its clinical applications and physiological meaning are frequently misunderstood [17, 18]. Many research articles have agreed that the CVP is affected by many factors [19, 20]. We need to know which factors affect the CVP measurement and how. Based on this knowledge, it may be possible to use them optimally in order control CVP. This may be easily understood from some probabilistic models. Best of our knowledge, there is not any probabilistic or statistical model of CVP with its explanatory variables [21]. In the report, we are interested to identify the explanatory factors of CVP for some shock patients. Therefore, the report seeks the following queries. What are the statistical significant components of CVP? How are the components related with the CVP? How do they act on CVP? What is the probability model of CVP with its component? These answers are little known in the cardio vascular literature, which are focused in the present report.
And ,
where and are GLM link functions related to the mean & variance linear predictors respectively, and , are the vectors of explanatory factors/ variables, connected to the mean & dispersion parameters respectively. Practically, the maximum likelihood (ML) and the restricted ML (REML) method are used respectively, for estimating the mean and dispersion parameters [23].
Model |
Covariate |
Estimate |
Standard error |
t-value |
P-Value |
Mean Model |
Constant |
-0.0111 |
0.47165 |
-0.024 |
0.9808 |
SURVIV (Fx42) |
0.3313 |
0.0985 |
3.363 |
0.0009 |
|
Mean arterial pressure (MAP) x7 |
0.0293 |
0.00648 |
4.52 |
<0.0001 |
|
Diastolic blood pressure (DBP) x9 |
-0.0369 |
0.00814 |
-4.528 |
<0.0001 |
|
Body surface index (BSI) x11 |
0.8039 |
0.20753 |
3.874 |
0.0001 |
|
Appearance time (AT) x13 |
-0.0468 |
0.01466 |
-3.195 |
0.0016 |
|
Mean circulation time (MCT)x14 |
0.0344 |
0.00731 |
4.702 |
<0.0001 |
|
Urinary output (UO) x15 |
-0.0013 |
0.00049 |
-2.532 |
0.012 |
|
Plasma volume index (PVI) x16 |
0.0064 |
0.003 |
2.142 |
0.0333 |
|
Red cell index (RCI) x17 |
0.002 |
0.00201 |
1.006 |
0.3155 |
|
Dispersion Model |
Constant |
0.119 |
1.4544 |
0.082 |
0.9347 |
BSI (x11) |
-1.7843 |
0.5821 |
-3.065 |
0.0024 |
|
MCT (x14) |
-0.0256 |
0.0112 |
-2.279 |
0.0236 |
|
UO (x15) |
0.0019 |
0.0009 |
2.163 |
0.0316 |
|
PVI (x16) |
0.0141 |
0.0091 |
1.549 |
0.1228 |
|
RCI (x17) |
-0.034 |
0.0143 |
-2.377 |
0.0183 |
|
Hemoglobin (HG) (x18) |
0.2062 |
0.061 |
3.381 |
0.0008 |
= exp. (-0.0111 + 0.3313 SURVIV + 0.0293MAP - 0.0369DBP + 0.8039BSI - 0.0468AP + 0.0344MCT -0.0013UO + 0.0064PVI + 0.0020RCI),
And the fitted variance ( ) model is
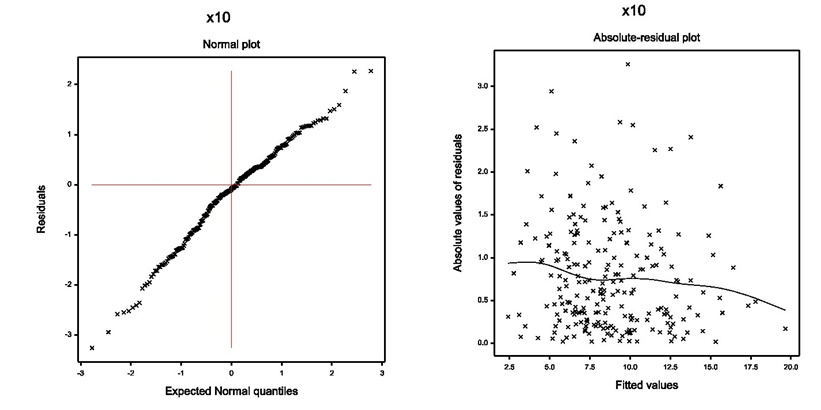
= exp. (0.1190 - 1.7843BSI - 0.0256MCT + 0.0019UO + 0.0141PVI - 0.0340RCI + 0.2061HG). Gamma fitted (for MCVP in Table 1) absolute residuals are plotted in Figure 1(a), with respect to fitted values, which is approximately straight line, indicating constant variance. Figure 1(b) shows the normal probability plot for the mean model (Table 1), which does not reveal any lack of fit. Both the plots do not show any inconsistency in fitting.
• MCVP is positively associated with SURVIV (survived=1, death=2) (P=0.0009), concluding that MCVP is higher for shock patients who are close to death than living patients.
• MCVP is directly associated with MAP (P< 0.0001), indicating that MCVP increases as MAP rises.
• MCVP is negatively correlated with DBP (P< 0.0001), interpreting that MCVP decreases as DBP increases.
• MCVP is directly associated with BSI (P=0.0001), concluding that MCVP increases as BSI rises.
• MCVP is negatively correlated with AP (P=0.0016), concluding that MCVP decreases as AP increases.
• MCVP is directly associated with MCT (P< 0.0001), indicating that MCVP increases as MCT rises.
• MCVP is negatively correlated with UO (P=0.0120), concluding that MCVP decreases as UO increases.
• MCVP is directly associated with PVI (P=0.0333), indicating that MCVP increases as PVI rises.
• MCVP is directly partially associated with RCI (P=0.3155), indicating that MCVP increases as RCI rises. From variance model (Table 1) of MCVP, the following conclusions can be noted.
• Variance of CVP (VCPV) is negatively associated with BSI (P=0.0024), concluding that VCPV decreases as BSI increases. • VCPV is negatively associated with MCT (P=0.0236), implying that VCPV decreases as MCT increases.
• VCPV is directly associated with UO (P=0.0316), implying that VCPV increases as UO rises.
• VCPV is directly partially associated with PVI (P=0.1228), implying that VCPV increases as PVI rises.
• VCPV is negatively associated with RCI (P=0.0183), implying that VCPV decreases as RCI increases.
• VCPV is directly associated with HG (P=0.0008), implying that VCPV increases as HG rises.
The above derived joint mean & variance models of MCVP have been selected based on examining the lowest AIC, model checking plots, small standard errors of the estimates (Table 1), and appropriate distribution of the response MCVP. Therefore, the data generated models of MCVP are assumed to be true. Based on the true derived models all the above interpretations have been drawn. Interpretations of all the derived results are clearly described in the above.
The above models are related only with the given data set [22]. If the data set is changed, model will be changed, but the association nature of MCVP with the other parameters may be same, even though the data set will be changed. We have not examined it for different data sets, as we have not more data sets. In our future research, we will examine these points. Here the considered data set does not contain many covariates related to blood components and cardiac parameters. Future researchers may consider many more covariates.
The current note may introduce some new information in the medical literature regarding the explanatory factors/ variables of central venous pressure through statistical modeling. From the beginning of medical literature, interpretation about CVP are frequently misunderstood [1, 2, 17 and 18]. Best of our knowledge, the above information and the fitted models of MCVP are not clearly introduced in any previous article based on statistical modeling. From the present results, medical practitioners can be able to know that CVP of a shock patient increases if MAP, or PVI, or BSI, or RCI, or MCT increases, or AP, or DBP, or UO decreases. Accordingly, necessary steps may be taken to control CVP.
- Reems MM, Aumann M. Central Venous Pressure: Principles, Measurement and Interpretation. Compendium. 2012; 34: E1-E10.
- Vellinga NAR, Ince C, Boerma EC. Elevated central venous pressure is associated with impairment of microcirculatory blood flow in sepsis: a hypothesis generating post hoc analysis. BMC Anesthesiology. 2013; 13: 17. doi: 10.1186/1471-2253-13-17
- Boerma EC, Ince C. The role of vasoactive agents in the resuscitation of micro vascular perfusion and tissue oxygenation in critically ill patients. Intensive Care Med. 2010; 36(12):2004–2018. doi: 10.1007/s00134-010-1970-x
- Thooft A, Favory R, Ribeiro Salgado D, Taccone FS, Donadello K, De Backer D, etal., Effects of changes in arterial pressure on organ perfusion during septic shock. Crit Care. 2011; 15(5):R222. doi: 10.1186/cc10462
- Dobbe JGG, Streekstra GJ, Atasever B, vanZijderveld R, Ince C. Measurement of functional microcirculatory geometry and velocity distributions using automated image analysis. Med Biol Eng Comput. 2008; 46(7):659–670. doi:10.1007/s11517-008-0349-4
- Dubin A, Pozo MO, Casabella CA, Pálizas F, Murias G, Moseinco MC, et al., Increasing arterial blood pressure with nor epinephrine does not improve microcirculatory blood flow: a prospective study. Crit Care. 2009; 13(3):R92. doi: 10.1186/cc7922
- De Backer D, Hollenberg S, Boerma C, Goedhart P, Büchele G, Ospina-Tascon G, etal., How to evaluate the microcirculation: report of a round table conference. Crit Care. 2007; 11(5):R101. doi:10.1186/cc6118
- Boyd JH, Forbes J, Nakada TA, Walley KR, Russell JA. Fluid resuscitation in septic shock: a positive fluid balance and elevated central venous pressure are associated with increased mortality. Crit Care Med. 2011; 39(2):259–265. doi: 10.1097/CCM.0b013e3181feeb15
- Michard F, Boussat S, Chemla D, Anguel N, Mercat A, Lecarpentier Y, et al., Relation between respiratory changes in arterial pulse pressure and fluid responsiveness in septic patients with acute circulatory failure. Am J Respir Crit Care Med. 2000; 162(1):134–138. doi:10.1164/ajrccm.162.1.9903035
- Heenen S, De Backer D, Vincent JL. How can the response to volume expansion in patients with spontaneous respiratory movements be predicted? Crit Care. 2006;10(4):R102. DOI:10.1186/cc4970
- Legrand M, Dupuis C, Simon C, Gayat E, Mateo J, Lukaszewicz AC, et al. Association between systemic hemodynamics and septic acute kidney injury in critically ill patients: a retrospective observational study. Crit Care. 2013;17(6):R278. doi: 10.1186/cc13133
- Chen KP, Cavender S, Lee J, Feng M, Mark RG, Celi LA, et al., Peripheral edema, central venous pressure, and risk of AKI in critical illness. Clin J Am Soc Nephrol. 2016;11(4):602–608. doi: 10.2215/CJN.08080715
- De Backer D, Ortiz JA, Salgado D. Coupling microcirculation to systemic hemodynamics. CurrOpinCrit Care 2010; 16(3):250–254. doi: 10.1097/MCC.0b013e3283383621
- Jhanji S, Stirling S, Patel N, Hinds CJ, Pearse RM. The effect of increasing doses of norepinephrine on tissue oxygenation and micro vascular flow in patients with septic shock. Crit Care Med. 2009; 37(6):1961–1966. doi: 10.1097/CCM.0b013e3181a00a1c
- Steele AM. Under pressure: ABP, CVP, what are the number really telling us? Proc 12th IVECCS 2006; 815-818.
- Fleming E, Ettinger S, DVM, Dacvim. Pulmonary hypertension. Compend Contin Edu Pract Vet. 2006; 28(10): 7720-7732.
- Magder S. Central venous pressure: a useful but not so simple measurement. Crit Care Med 2006; 34(8): 2224-2227. doi:10.1097/01.CCM.0000227646.98423.98
- Clayton DG. Inaccuracies in manometric central venous pressure measurement. Resuscitation. 1988; 16(3): 221-230.
- Cecconi M, Hofer C, Teboul JL, Pettila V, Wilkman E, Molnar Z, et al., Fluid challenges in intensive care—the FENICE study: A global inception cohort study. Intensive Care Med.2015; 41(9):1529–1537. doi:10.1007/s00134-015-3850-x
- Eskesen TG, Wetterslev M, Perner A. Systematic review including re-analyses of 1148 individual data sets of central venous pressure as a predictor of fluid responsiveness. Intensive Care Med. 2016; 42(3):324–332. doi: 10.1007/s00134-015-4168-4
- Das RN. The Central Venous Pressure Causality Factors. Journal of General Practice (Los Angel)2017;5(3):e116. doi:10.4172/2329-9126.1000e116
- Afifi AA, Azen SP. Statistical analysis: A computer oriented approach, 2nd ed. Academic Press, New York. 1979.
- Lee Y, Nelder JA, Pawitan Y. Generalized Linear Models with Random Effects (Unified Analysis via H–likelihood). New York: 2006. Chapman & Hall.
- Das RN and Lee Y. Log-normal versus gamma models for analyzing data from quality-improvement experiments. Quality Engineering. 2008; 21(1): 79-87. doi: 10.1080/08982110802317372
- Das RN and Lee Y. Analysis strategies for multiple responses in quality improvement experiments. International Journal of Quality Engineering and Technology. 2010; 1(4): 395-409. doi: 10.1504/IJQET.2010.035585
- Das RN. Robust Response Surfaces, Regression, and Positive Data Analyses. Chapman & Hall. London. 2014. 336.
- Hastie T, Tibshirani R, Friedman J. The Elements of Statistical Learning. Springer-Verlag. 2009.
- Das RN. Discrepancy in fitting between log-normal and gamma models: An illustration. Model Assisted Statistics and Applications. 2012; 7 (1): 23–32. doi: 10.3233/MAS-2011-0198
- Das RN. Systolic & Diastolic Blood Pressure Determinants of Shock Patients. J Heart Cardiol. 2017; 3(2): 12-30. doi: 10.15436/2378-6914.17.1740
- Das RN. Shock patients heart rate variability factors. Journal of Cardiovascular Medicine and Therapeutics. 2017; 1(2):19-23.

