


Methods: 10, 580 patients were selected for this study. Retinopathy was graded as: within normal limits (WNL), non-proliferative diabetic retinopathy (npdr mild, moderate or severe), or proliferative diabetic retinopathy (PDR) . For detection of diabetic kidney disease (DKD), patients were screened for elevated serum creatinine, microalbuminuria, and spot urine protein. Serum creatinine ≥ 1.5 mg/dl was labeled as “DKD”.
Results: Severity (grading) of retinopathy increases with the advancement of duration of diabetes, HbA1c , serum creatinine, microalbuminuria, spot urine protein, and blood pressure (systolic and diastolic). ANOVA model P-values were significant for all tested variables (p < 0.0001 for all). Group of patients with maculopathy have higher levels of HbA1c, duration of diabetes, serum creatinine, microalbuminuria, spot urine protein and creatinine and their ratio (PCR), systolic and diastolic blood pressure with significant p-values. Significant , χ2 associations were observed for retinopathy with hypertension, and nephropathy with DKD (odds ratio 2.29 and 2.1, respectively; p < 0.0001 for all). For the development of retinopathy, ROC curve demonstrated cutoff point of 8.9 % (g/dl) for HbA1c, with 67% sensitivity and 50% specificity; 129 mmhg for systolic BP with 70% sensitivity and 55% specificity; and 79 mmhg for diastolic BP with 63% sensitivity and 51% specificity.
Conclusion: We concluded that all diabetic patients should be screened early for the detection of retinopathy, nephropathy, elevated serum creatinine, HbA1c and hypertension to prevent further diabetes complications.
Diabetic retinal disease and pathology is the commonest cause of visual impairment in patients with diabetes. Poor glycemic control, raised blood pressure (BP), duration of diabetes, and microalbuminuria or proteinuria are the main risk factors which initiates and then complicates this pathology [13,14].
The likelihood of developing diabetic retinopathy is related to the duration of the disease. The rate of onset is variable, but after twenty years after the diagnosis of diabetes, 80% of type- 2 diabetics and nearly all type-1 diabetics show some signs of retinopathy [15,16 ].
The damaged retinal capillaries due to hyperglycemia are weak and possess out-pouchings of the vessel lumens (micro aneurysms), which eventually rupture to form hemorrhages within the retina, confined by the internal limiting membrane (ILM); they appear like dots and are called “dot-and-blot” hemorrhages. These fragile capillaries may leak fluid into the retina. When fluid is deposited under the macula (called “macular edema”), this interferes with the fine vision and common cause of vision loss with diabetic retinopathy (DR). Resolution/ reabsorption of this fluid leaves behind the sediment, composed lipid byproducts which appears waxy and yellow (called “hard exhudates”). As DR progresses, the blood vessels may also become obstructed causing oxygen supply compromise and resulting in infarction of the nerve fiber layer, which appears as fluffy, white patches (called “cotton wool spots, CWS”) [17 ].
Although different classification or grading systems are available (such as Early Treatment Diabetic, ETDRS), conventionally, involvement of retina in diabetic state has been classified into three categories; background , preprolifrative retinopathy and proliferative retinopathy. Macula may be involved pathologically (called maculopathy/diabetic maculopathy) with any of these forms of retinopathy. Hence, retinopathy which affects the macula is separately described as diabetic maculopathy
For simplicity, retinopathy has also been classified as:
1- No visible retinopathy (within normal limits WNL) or normal fundus
2-Non proliferative diabetic retinopathy, NPDR (i.e., without neovascularization or abnormal blood vessel growth). This is further classified as early or mild non-proliferative retinopathy (micro-aneurysms only); moderate NPDR (characterized by multiple micro aneurysms, dot-and-blot hemorrhages, venous beading, and/or cotton wool spots); severe NPDR (hemorrhages/ micro aneurysms, cotton wool spots, venous beading, and severe intra retinal micro vascular abnormalities, IRMA). Within one year, 52-75% of patients falling into this category will progress to PDR [18].
3- Proliferative diabetic retinopathy, PDR (presence of neovascularization on the disc or elsewhere, NVE) and has a potential of serious visual consequences, such as vision loss, and poor prognosis. The retina has a high metabolic requirement; hence with continued ischemia, retinal cells respond by releasing angiogenic chemicals, factors and modulators such as vascular endothelial growth factor (VEGF), which stimulate growth of new retinal blood vessels to maintain the retinal blood supply and leading to the neovascularization. New vessels are leaky, fragile, and often misdirected and these may even grow off the retina and into the vitreous. As the vitreous shrinks with age, it pulls on these fragile vessels, casing rupture of new vessels resulting in a vitreous hemorrhage and sudden vision loss (called separately as “high risk PDR”). The new vessels are also the cause scar formation (with the time) and this result in strong anchors between the retina and vitreous causing tractional retinal detachment with extensive vitreous hemorrhage (defined separately as “advanced PDR”) causing sudden vision loss. If not treated urgently (especially with maculopathy), permanent vision loss may result. Involvement of the macula with exudative or ischemic changes has a potential to involve the fovea, thus threatening vision. Exudative maculopathy may be amenable to treatment, but ischemic changes are not (diagnosed ideally by fluorescein angiography). [19-21].
In the past association of nephropathy (and its markers) and blood pressure with retinopathy have not been studied. Under this literature review and research background, our objective was to investigate association of diabetic retinopathy (and maculopathy) with impaired glycemic control, elevated blood pressure and with diabetic kidney disease markers (creatinine, microalbuminuria, and spot urine protein); and to study the association of diabetic retinopathy and diabetic kidney disease.
Systolic and diastolic blood pressure (BP, in mmHg) were measured by standardized methodology in resting position. Retinopathy was graded as: Within Normal Limits (WNL), Non-Proliferative Diabetic Retinopathy (NPDR either mild, moderate or severe), or Proliferative Diabetic Retinopathy (PDR), according to International Clinical Diabetic Retinopathy (DR) Disease Severity Scale [22]. Fundus or retina was examined by using computerized digital fundus photography camera (NIDEK Corporation, USA; approved by FDA for fundus photography). The data were reviewed by electronic file system and hospital information system (details given below).
Spot urine protein was measured by UCFP (Urinary/ Cerebrospinal Fluid Protein) method on Dimension® clinical chemistry system (Siemens healthcare diagnostics Inc. Newark, DE 19714, U.S.A). This is in vitro diagnostic test intended for the direct quantitative determination of total protein in human urine and cerebrospinal fluid, which is an adaptation of pyrogallol red molybdenum method by Y. Fujita, I. Mori and S. Kitano [26]. In the reaction sequence, pyrogallol red combined with sodium molybdate to form a red complex with maximum absorbance at 470 nm. The protein in the sample reacted with this complex in acid solution to form a bluish-purple colored complex, which absorbs at 600 nm. The absorbance at 600 nm was directly proportional to the concentration of protein in the sample. The analyte concentration was determined by calculation using a logit curve fit on a previously stored calibration curve. PCR (protein to creatinine ratio) was measured by spot urine protein / spot urine creatinine.
HbA1c was measured by A1c Flex® Reagent by the Dimension® clinical chemistry system, in vitro diagnostic assay for the quantitative determination of both percent hemoglobin A1c and total hemoglobin, based on a turbid metric inhibition immunoassay (TINIA) principle, and the measurement of total hemoglobin is based on a modification of the alkaline hematin reaction, an NGSP certified methodology (Siemens healthcare diagnostics Inc. Newark, DE 19714, USA). The percentage of total hemoglobin that is glycated was calculated and reported as %HbA1c (in g/dL), and final result has been standardized to the results obtained in DCCT.
For the detection of nephropathy and presence of albumin or protein in urine, fasting urine samples were examined for the presence of microalbuminuria, macro albuminuria or proteinuria. All urine samples were first examined for the presence of gross proteinuria by Quick Check™ urinalysis reagent strips (ACON biotech, Co., Ltd.) to rule out macro albumin in urine. This technique is based on the phenomenon of pH indicators which releases hydrogen ions to the protein. Samples which demonstrated macro albuminuria (in mg/dl) or gross proteinuria by the color indicator of the reagent strips (ranging from 1+ to 4+) were defined/labeled as “nephropathy”. Samples with negative albumin were further examined for the presence of micro albumin in urine by MALB method used by Dimension® clinical chemistry system and device, in vitro diagnostic test for quantitative measurement of albumin (mg/L) in human urine by particle-enhanced turbid metric inhibition immunoassay (PETINIA) methodology (Siemens Healthcare Diagnostics Inc. Newark, DE 19714, USA). Samples demonstrating microalbuminuria (albumin excretion in urine in the range of 30- 300 mg/L) were also labeled and defined as nephropathy.
Patients demonstrating levels of serum creatinine > 1.5 were defined as chronic renal/kidney disease (CRD/CKD) and these diabetic subjects were also considered “diabetic kidney disease” (DKD). Furthermore, patients demonstrating microalbuminuria or gross proteinuria were labeled as “nephropathy”.
All laboratory sample requests were entered in a computer software and results retrieved by Natcom Hospital Information System (NATCOM HIS; National Computer System Co. Ltd [27].
ANOVA methodology was utilized to measure significant associations between the retinopathy groups and continuous variables, while assuring that all participants/data and their groups were independent. Post-hoc tests, least significant difference LSD and Bonferroni were also performed to assess the significant difference between the means of the groups of the graded retinopathy.
χ2 test (chi-square test for independence and association / Pearson’s chi-square test ) was utilized for significant analysis of diabetic retinopathy with nephropathy and DKD associations. Logistic Regression, Odds Ratio and Protective Odds Ratio were used to measure associations of retinopathy with hypertension, nephropathy and DKD. Statistical power of 90% was built for detection of significance and p-values (two-sided) of less than 0.05 were considered significant. This study was reviewed and approved by the research committee of Aseer Diabetes Center, and all methodologies on subjects reported in current study were in accordance with the Helsinki Declaration of 1975 (revised in 2008).
Regarding retinopathy, the data are shown in table-2. Overall, 56% demonstrated normal fundus, while 44% demonstrated retinopathy during fundus examination. Retinopathy and fundus screening status is presented in table-2. Descriptive statistics for variables are shown in table-3.
Table-4 demonstrates the ANOVA statistics between variables and different stages of retinopathy. It is evident form the table that severity of retinopathy (and its grading) increases with the advancement of duration of diabetes, HbA1c, serum creatinine, microalbuminuria, spot urine protein, and blood pressure (systolic and diastolic). It can be observed that p-values for ANOVA model are significant for all tested variables (< 0.0001 for all; 0.002 for urine creatinine).
Patients with maculopathy were analyzed separately (regardless of stages of retinopathy). The data for the patients with maculopathy is shown in table-5. This table demonstrates levels of HbA1c, duration of diabetes, serum creatinine, microalbuminuria, spot urine protein and creatinine and their ratio (PCR), systolic and diastolic blood pressure. It is evident that there is a significant difference between the group of patients with or without maculopathy, with significant p-values.
Parameters |
Description with N (%) ; Totals = 10,580 |
|
Gender |
Male |
Female |
6242 (59%) |
4338 (41%) |
|
Type of Diabetes |
Type-1 |
Type-2 |
1587 (15%) |
8993 (85%) |
|
Nephropathy |
Positive |
Negative |
3914 (37%) |
6666 (63%) |
|
Hypertension (HTN) |
Positive |
Negative |
4549 (43%) |
6031 (57%) |
|
Diabetic Kidney Disease (DKD) status |
Positive |
Negative |
1481 (14%) |
9099 (86%) |
|
Diabetic Retinopathy Status (N;%) |
|
Normal (no diabetic retinopathy) |
56 % |
Patients with diabetic retinopathy (total numbers) |
44 % |
Mild NPDR |
24 % |
Moderate NPDR |
11 % |
Severe NPDR |
4 % |
Proliferative DRP |
5 % |
Overall patients with Maculopathy |
14 % |
Variables |
Mean ± SD |
Age (years) |
53 ± 13.5 |
Diabetes duration (years) |
17 ± 8.7 |
Serum creatinine (mg/dl) |
0.967 ± 0.593 |
HbA1c % (g/dl) |
7.88 ± 1.51 |
Micro albumin in urine (mg/L) |
67 ± 103 |
Spot Urine protein |
52.8 ± 28.9 |
Urine creatinie mg/dl |
119.6 ± 71.87 |
Protein to creatinine ratio (PCR) |
.6025 ± 2.06 |
Systolic BP |
128.7 ± 16.4 |
Diastolic BP |
79.23 ± 9 |
Type of DiabeticRetinopahty (grading) with mean ± SD 95% CI ; p-values |
|||||||
Variables and indicators |
Within Normal Limits |
Mild NPDR |
Moderate NPDR |
Severe NPDR |
Proliferative diabetic retinopathy (PDR) |
ANOVA statistics ; Post-hoc tests |
ANOVA model p-values |
HbA1c % (g/dl) |
7.62 ± 1.51 7.49 to 7.75 |
8 ± 1.31 7.8 to 8.3 |
8.1 ± 1.47 7.9 to 8.4 |
8.22 ± 1.29 7.7 to 8.3 |
8.36 ± 1.3 8 to 8.7 |
F= 7.23; LSD and Bonferroni p-values < 0.05 |
< 0.0001 |
Duration of diabetes |
14.8 ± 7.8 14.3 to 15.4 |
22.5 ± 8.4 21.6 to 23.5 |
25 ± 7.24 23.7 to 26.1 |
27.2 ± 7.25 24.4 to 30 |
28.77±7.78 27 to 30.4 |
F=128; LSD and Bonferroni p-values < 0.05 |
< 0.0001 |
Serum creatinine (mg/dl) |
0.87 ± 0.475 0.836 to 0.903 |
0.976 ±0.636 0.904 to 1 |
1.1 ± 0.943 0.956 to 1.26 |
1.13 ± 0.568 0.908 to 1.35 |
1.5 ± 1.31 1.2 to 1.78 |
F = 19; LSD and Bonferroni p-values < 0.05 |
< 0.0001 |
Micro albu-min in urine (mg/L) |
35 ± 18 28.3 to 39 |
70 ± 65.5 55 to 84.9 |
141 ± 101 92 to 160 |
180 ± 115 102 to 183 |
193 ± 131 133 to 198 |
F = 13.8; LSD and Bonferroni p-values < 0.05 |
< 0.0001 |
Spot Urine protein (mg/dl) |
31.9± 28.7 22.6 to 41 |
58.46 ± 40.8 36 to 90.5 |
70 ± 69.3 55.6 to 120 |
152 ± 138 130 to 239 |
209 ± 196 189 to 396 |
F = 12.4; LSD and Bonferroni p-values < 0.05 |
< 0.0001 |
Urine creatinie mg/dl |
126 ± 65 120 to 135 |
112.3 ± 55.5 107 to 130 |
108 ± 54.53 97 to 116 |
103 ± 48.8 90 to 134 |
88.78± 39.7 77.6 to 100 |
F = 4.5; LSD and Bonferroni p-values < 0.05 |
0.002 |
PCR |
0.2 ± 0.13 0.12 to 0.21 |
0.61 ± 1.58 0.4 to 0.85 |
1.07 ± 2.7 0.58to 1.65 |
1.79 ± 3.22 0.89 to 2.7 |
2.6 ± 7 0.99 to 5.7239 |
F = 13.2; LSD and Bonferroni p-values < 0.05 |
< 0.0001 |
Systolic BP |
124 ± 15 123 to 126 |
132.5 ± 15.6 130.5 to134.4 |
135.5 ± 15.6 133 to 137 |
136.5 ± 12.4 132 to 143 |
141± 19.5 139 to 148.5 |
F = 33; LSD and Bonferroni p-values < 0.05 |
< 0.0001 |
Diastolic BP |
78 ± 8.5 77 to 78.6 |
79.9 ± 8.9 78.7 to 80.75 |
82.3 ± 9.2 78.9 to 82.84 |
83.54 ± 9.4 79 to 84.12 |
85.49 ± 9.56 81.5 to 85.5 |
F = 11; LSD and Bonferroni p-values < 0.05 |
< 0.0001 |
Variables |
Mean ± SD ; 95% CI |
T-statistics |
|||
With Maculopathy |
Without Maculopathy |
F-value |
T-value |
P-value |
|
HbA1c % (g/dl) |
8.3 ± 1.5 ; 8 to 8.6 |
7.7 ± 1.46; 7.6 to 7.9 |
2.1 |
3.7 |
0.001 |
Duration of diabetes |
27.2 ± 7.8 ; 26 to 28.5 |
17.7 ± 8.86; 17.2 to 18.3 |
2.5 |
13.1 |
< 0.0001 |
Serum creatinine (mg/dl) |
1.3 ± 1.17 ; 1.13 to 1.5 |
0.91 ± 0.56; 0.883 to 0.947 |
75.4 |
7 |
< 0.0001 |
Micro albu-min in urine (mg/L) |
99.3 ± 138; 69.9 to 128.5 |
64.4 ± 109; 56.3 to 72.4 |
10.5 |
2.74 |
0.001 |
Spot Urine protein (mg/dl) |
82.7 ± 143; 53.6 to 112.7 |
50.4 ± 119; 38.3 to 62.5 |
5.6 |
2.1 |
0.02 |
Urine creatinie mg/dl |
97.5±46.9; 87.9 to 106.9 |
122.7±117.4 to 128.4 |
6.6 |
3.1 |
0.001 |
PCR |
1.1±2.1 ; 0.68 to 1.52 |
0.55 ± 1.9; 0.398 to 0.6 |
8.9 |
2.4 |
0.03 |
Systolic BP |
137±17; 135 to 140 |
127± 15; 126 to 129 |
3.2 |
5.6 |
< 0.0001 |
Diastolic BP |
83.6± 8.8; 80.5 to 83.4 |
78±7.9; 77.4 to 79.2 |
2.7 |
4.3 |
< 0.0001 |
It can be observed from the table that χ2 value and odds ratio for retinopathy with HTN, nephropathy and DKD are 55.2 and 2.29 (95% CI 1.84 to 2.86), 42.6 and 2.1 (95% CI 1.7 to 2.63), 21.2 and 2.7 (95% CI 1.74 to 4.1) respectively with significant p-values (< 0.0001 for all).
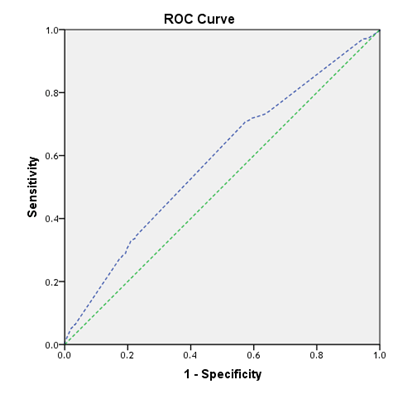
To explore the cutoff values for HbA1c and blood pressures, receiver operating curve (ROC) was used. Table-7 demonstrates the cut off value for HbA1c for the development of diabetic retinopathy; HbA1c 8.9 % (g/dl) was found to be cutoff point for the development of retinopahty with 67% sensitivity and 50% specificity (AUC = 0.61; 95% CI 0.58 to 0.64; p< 0.0001). Graphically, this is presented in figure-1.


The complications of diabetes usually co-exist and progress together, if diabetes state is uncontrolled. Diabetic nephropathy (DN) and retinopathy also usually progress together. Type-2 diabetic subjects with proteinuria and retinopathy usually have a glomerulopahty or renal pathology. Furthermore, presence of retinopathy suggests that diabetic proteinuria or albuminuria
Variables tested for χ2 |
Chi-square statistics with odds ratio and 95% CI |
||||
χ2 Value |
Fisher’s exact test |
Linear-by-linear |
χ2 p-value |
Logistic |
|
Retinopathy and HTN |
55.2 |
< 0.0001 |
< 0.0001 |
< 0.0001 |
2.29 ; 95 % CI 1.84 to 2.86 |
Retinopathy and nephropathy |
42.6 |
< 0.0001 |
< 0.0001 |
< 0.0001 |
2.1 ; 95% CI 1.7 to 2.63 |
Retinopathy and DKD/CKD |
21.2 |
< 0.0001 |
< 0.0001 |
< 0.0001 |
2.7 ; 95% CI 1.74 to 4.1 |
Test variables |
Area under the curve (AUC) |
Standard |
95% CI |
P-Value |
Coordinate HbA1c cutoff points for the development of diabetic retinopathy |
Diabetic retinopathy and HbA1c |
0.61 |
0.015 |
0.580 to 0.640 |
< 0.0001 |
8.9 % (g/dl) |