


2High school of technology, University Moulay Ismail, Meknes, Morocco
This study shows that the ANN has served marginally better to predict antitumor activity when compared with the results given by predictions made with MLR and MNLR.
Keywords: DFT; QSAR; Tumor cells; Artificial Neural Network; Cross Validation;
The objectives of the current work are to develop predictive QSAR models and to identify the chemical structural features important among our studied molecules for the antitumor cells activity. Thus, a number of quantum chemical methods and calculations have been performed in order to study the molecular structure and antitumor activity [36].
To find the quantitative relationship between molecular structure and antitumor activity for the data taken by K. Srikanth et al. [24], the researcher used the MLR, MNLR and ANN, then they calculated the electronic descriptors by the Gaussian 03 to generate QSAR sets. The MLR was utilized to select the structural features of the molecules relevant to the antitumor activity and to construct the linear model; this last model was used to select descriptors as input parameters for the ANN, which was constructed as the nonlinear model. Both models were validated by an internal validation methods including cross-validation to characterize robustness and an external validation to estimate the predictive power of the models. Finally, the ultimate objective was to establish reliable QSAR models to inhibition of tumor weight prediction of 5-N-substituted-2-(substituted benzenesulphonyl) glutamines.
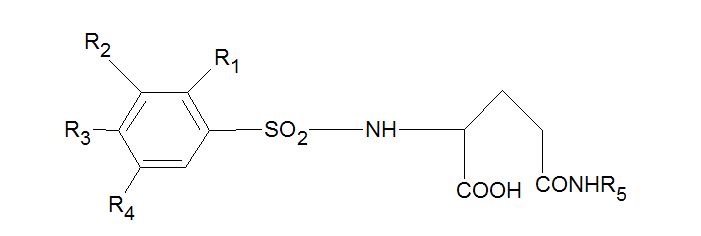
Compound |
R1 |
R2 |
R3 |
R4 |
R5 |
% Inhibition of Tumor weight (IT) |
Log(IT) |
1 |
H |
H |
H |
H |
i-Butyl |
52.73 |
1.722 |
2 |
H |
H |
CH3 |
H |
i-Propyl |
50 |
1.699 |
3 |
H |
H |
CH3 |
H |
i-Butyl |
25 |
1.398 |
4 |
CH3 |
H |
H |
NO2 |
H |
37.5 |
1.574 |
5 |
CH3 |
H |
H |
NO2 |
CH3 |
68.75 |
1.837 |
6* |
CH3 |
H |
H |
NO2 |
C2H5 |
25 |
1.398 |
7 |
CH3 |
H |
H |
NO2 |
n-C3H7 |
50 |
1.699 |
8 |
CH3 |
H |
H |
NO2 |
n-C4H9 |
62.5 |
1.796 |
9* |
CH3 |
H |
H |
NO2 |
i-Propyl |
62.5 |
1.796 |
10 |
CH3 |
H |
H |
NO2 |
i-Butyl |
12 |
1.079 |
11 |
CH3 |
H |
H |
NO2 |
C6H11 |
33 |
1.519 |
12 |
CH3 |
H |
H |
NO2 |
C6H5 |
33 |
1.519 |
13 |
CH3 |
H |
H |
NO2 |
C6H5CH2 |
60.17 |
1.779 |
14 |
CH3 |
H |
H |
NO2 |
n-C5H11 |
60.83 |
1.784 |
15 |
CH3 |
H |
H |
NO2 |
n-C6H13 |
67.37 |
1.828 |
16* |
H |
NO2 |
CH3 |
H |
H |
49.53 |
1.695 |
17 |
H |
NO2 |
CH3 |
H |
CH3 |
40.86 |
1.611 |
18 |
H |
NO2 |
CH3 |
H |
C2H5 |
27.05 |
1.432 |
19 |
H |
NO2 |
CH3 |
H |
n-C3H7 |
26.95 |
1.431 |
20 |
H |
NO2 |
CH3 |
H |
n-C4H9 |
41.37 |
1.617 |
21 |
H |
NO2 |
CH3 |
H |
n-C5H11 |
24.88 |
1.396 |
22 |
H |
NO2 |
CH3 |
H |
n-C6H13 |
59.45 |
1.774 |
23 |
H |
NO2 |
CH3 |
H |
i-Propyl |
37.64 |
1.576 |
24* |
H |
NO2 |
CH3 |
H |
i-Butyl |
45.95 |
1.662 |
25 |
H |
NO2 |
CH3 |
H |
C6H11 |
35.33 |
1.548 |
26 |
H |
NO2 |
CH3 |
H |
C6H5CH2 |
22.35 |
1.349 |
27* |
H |
NO2 |
CH3 |
H |
C6H5 |
59.6 |
1.775 |
28 |
H |
H |
C2H5 |
H |
CH3 |
90.45 |
1.956 |
29 |
H |
H |
C2H5 |
H |
C2H5 |
38.46 |
1.585 |
30 |
H |
H |
C2H5 |
H |
n-C3H7 |
65.64 |
1.817 |
31 |
H |
H |
C2H5 |
H |
n-C4H9 |
55.64 |
1.745 |
32 |
H |
H |
C2H5 |
H |
n-C5H11 |
56.36 |
1.751 |
33 |
H |
H |
C2H5 |
H |
n-C6H13 |
65.37 |
1.815 |
34 |
H |
H |
C2H5 |
H |
-CH(CH3)2 |
41.53 |
1.618 |
35* |
H |
H |
C2H5 |
H |
C6H5CH2 |
37.5 |
1.574 |
36 |
H |
H |
C2H5 |
H |
C6H5 |
70.76 |
1.85 |
χ was determined by the following equations:
The Multiple Linear Regression (MLR) statistical technique was used to study the relation between one dependent variable and several independent variables. It is a mathematic technique that minimizes differences between actual and predicted values. The statistical qualities of the MLR equation were judged by parameters such as the R2 value (coefficient of determination), the F value (Fischer statistics) and the RMSE value (Root Mean Squared Error). The MLR was generated using the software XLSTAT 2015, to predict the antitumor activity (IT) and was manipulated to select the descriptors used as the input parameters in the Multiple Non Linear Regression (MNLR) and Artificial Neural Network (ANN) [34].
Nonlinear models were then developed by submitting the selected descriptors from MLR to a three-layer, fully connected, feed forward ANN. The number of input neurons was as equal as that of the descriptors in the linear model. The number of hidden neurons was optimized by a trial and error procedure on the training process. One output neuron was used to represent the experimental % inhibition of tumor weight Log (IT). To avoid overtraining, one tenth of the data from the training set was randomly selected as a separate validation set to monitor the training process that is during the training of the network the performance was monitored by predicting the values for the systems in the validation set. When the results for the validation set ceased to improve, the training was stopped [13].
In order to check the reliability and the stability of QSAR model elaborated by MLR, MNLR and ANN methods, both the internal and external validations were conducted. The goodness of the fitting was firstly characterized by the coefficient of determination (R2) between calculated and experimental values for the molecules of the training set. The formula is given by equation:
QSAR model is successful if it satisfies the following criteria: .
To further refine the predictive ability of the developed QSAR models, another group of metrics was used: the rm2 metrics. They determine the proximity between the observed and predicted activities, was introduced by Roy and Ojha [21, 31]. They are calculated based on the correlation between the observed and predicted response data. Presently two different indicators are calculated for both the training (internal validation) and the test (external validation) sets: and For an acceptable QSAR model, should be > 0.5, and should be < 0.2.
The set of sixteen descriptors encoding the 36 compounds of 5-N-substituted-2-(substituted benzenesulphonyl) glutamines, electronic, energetic and topologic parameters are submitted to PCA analysis [13]. The first three principal axes are sufficient to describe the information provided by the data matrix. Indeed, the percentages of variance are 30.36%, 20.95% and 15.95% for the axes F1, F2 and F3, respectively. The total information was estimated to a percentage of 67.26%. The principal component analysis (PCA) [32] was conducted to identify the link between the different variables. Bold values are different from 0 at a significance level of p= 0.05.
The Pearson correlation coefficients were summarized in the following Table 3. The obtained matrix provides information on the negative or positive correlation between variables.
A strong correlation is observed between MW and ShA (r = 0.995), high a negative correlation is between MW and Et (r = -0.965), and a high correlation is observed between ShA and Et (r = -0,945).
Analysis of projections according to the planes F1–F2 and F1- F3 (51.31% and 46.31% of the total variance respectively) of the studied molecules (Fig. 2) shows that the molecules are dispersed in two regions: region 1 contains compounds having a values of total energy Et between -49709,561 (eV) and -45559,132 (eV), region 2 contains compounds having a values of total energy Et between -45211,746 (eV) and -38920,188 (eV).
N° |
Log (IT) |
MW |
D |
LogP |
Eb |
ChM |
Es |
Ee |
ShA |
ShC |
Et |
EHOMO |
ELUMO |
m |
χ |
TNC |
Ea |
1 |
1,722 |
342,41 |
1,253 |
0,733 |
13,343 |
0,131 |
118,836 |
-31761 |
21,043 |
1,00 |
-39990,72 |
-6,621 |
-3,195 |
7,688 |
-4,908 |
-9,910 |
2,763 |
2 |
1,699 |
342,41 |
1,253 |
1,003 |
13,352 |
0,133 |
81,472 |
-31303 |
21,043 |
0,85 |
-39990,88 |
-6,637 |
-3,305 |
8,023 |
-4,971 |
-9,805 |
2,205 |
3 |
1,398 |
356,44 |
1,231 |
1,221 |
13,547 |
0,132 |
89,597 |
-55577 |
22,041 |
0,85 |
-41061,16 |
-6,553 |
-2,441 |
6,856 |
-4,497 |
-10,526 |
4,327 |
4 |
1,574 |
345,33 |
1,501 |
-0,597 |
13,445 |
0,151 |
124,324 |
-31824 |
21,043 |
0,83 |
-42347,69 |
-6,594 |
-3,292 |
7,613 |
-4,943 |
-9,125 |
4,038 |
5 |
1,837 |
359,35 |
1,428 |
-0,361 |
13,446 |
0,148 |
237,583 |
-33793 |
22,041 |
1,00 |
-43418,03 |
-6,574 |
-3,214 |
7,885 |
-4,894 |
-9,418 |
3,641 |
6 |
1,398 |
373,38 |
1,392 |
-0,023 |
13,446 |
0,132 |
240,852 |
-35745 |
23,040 |
0,87 |
-43418,03 |
-6,574 |
-3,214 |
7,885 |
-4,894 |
-9,418 |
3,632 |
7 |
1,699 |
387,41 |
1,361 |
0,463 |
13,446 |
0,125 |
243,938 |
-37609 |
24,038 |
1,00 |
-45559,13 |
-6,561 |
-3,153 |
8,162 |
-4,857 |
-10,342 |
3,627 |
8 |
1,796 |
401,43 |
1,333 |
0,880 |
13,446 |
0,125 |
246,975 |
-39468 |
25,037 |
0,85 |
-46629,64 |
-6,557 |
-3,137 |
8,215 |
-4,847 |
-10,790 |
3,620 |
9 |
1,796 |
387,41 |
1,359 |
0,295 |
13,727 |
0,135 |
237,493 |
-38022 |
24,038 |
0,85 |
-45559,20 |
-6,535 |
-2,853 |
8,055 |
-4,694 |
-10,375 |
3,138 |
10 |
1,079 |
401,43 |
1,332 |
0,513 |
13,717 |
0,134 |
243,411 |
-40586 |
25,037 |
0,85 |
-46629,58 |
-6,522 |
-2,685 |
8,206 |
-4,603 |
-10,989 |
4,237 |
11 |
1,519 |
427,47 |
1,390 |
1,187 |
13,924 |
0,128 |
242,563 |
-43662 |
27,034 |
0,85 |
-48738,06 |
-6,528 |
-2,720 |
7,399 |
-4,624 |
-11,186 |
4,086 |
12 |
1,519 |
421,42 |
1,452 |
1,302 |
13,445 |
0,199 |
249,208 |
-41243 |
27,034 |
0,87 |
-48639,08 |
-6,425 |
-3,630 |
7,482 |
-5,027 |
-10,095 |
2,779 |
13 |
1,779 |
435,45 |
1,394 |
1,372 |
13,446 |
0,198 |
241,799 |
-44337 |
28,033 |
1,00 |
-49709,56 |
-6,521 |
-2,985 |
7,825 |
-4,753 |
-9,735 |
2,235 |
14 |
1,784 |
415,46 |
1,307 |
1,298 |
13,687 |
0,127 |
244,960 |
-41310 |
26,035 |
1,00 |
-47700,16 |
-6,522 |
-2,873 |
8,439 |
-4,697 |
-11,076 |
4,063 |
15 |
1,828 |
429,49 |
1,285 |
1,715 |
13,884 |
0,118 |
242,747 |
-43102 |
27,034 |
0,88 |
-48770,67 |
-6,521 |
-2,872 |
8,430 |
-4,697 |
-11,687 |
4,056 |
16 |
1,695 |
345,33 |
1,501 |
-0,597 |
13,445 |
0,148 |
108,939 |
-31556 |
21,043 |
0,83 |
-42347,62 |
-6,871 |
-2,875 |
8,074 |
-4,873 |
-9,111 |
4,025 |
17 |
1,611 |
359,35 |
1,428 |
-0,361 |
13,446 |
0,119 |
112,573 |
-33511 |
22,041 |
1,00 |
-43418,07 |
-6,842 |
-2,905 |
7,832 |
-4,873 |
-9,390 |
3,584 |
18 |
1,432 |
373,38 |
1,392 |
-0,023 |
13,446 |
0,147 |
115,783 |
-35441 |
23,040 |
0,85 |
-44488,66 |
-6,789 |
-2,860 |
7,610 |
-4,824 |
-9,869 |
3,588 |
19 |
1,431 |
387,41 |
1,361 |
0,463 |
13,446 |
0,124 |
118,840 |
-37291 |
24,038 |
1,00 |
-45559,18 |
-6,755 |
-2,830 |
7,622 |
-4,792 |
-10,323 |
3,587 |
20 |
1,617 |
401,43 |
1,333 |
0,880 |
13,446 |
0,122 |
121,877 |
-39133 |
25,037 |
0,87 |
-46629,69 |
-6,737 |
-2,815 |
7,851 |
-4,776 |
-10,770 |
3,583 |
21 |
1,396 |
415,46 |
1,307 |
1,298 |
13,446 |
0,125 |
124,904 |
-40938 |
26,035 |
1,00 |
-47700,21 |
-6,726 |
-2,806 |
7,404 |
-4,766 |
-11,219 |
3,581 |
22 |
1,774 |
429,49 |
1,285 |
1,715 |
13,446 |
0,123 |
127,929 |
-42741 |
27,034 |
0,88 |
-48770,72 |
-6,718 |
-2,800 |
7,592 |
-4,759 |
-11,493 |
3,580 |
23 |
1,576 |
387,41 |
1,359 |
0,295 |
13,727 |
0,170 |
125,653 |
32749 |
24,038 |
0,85 |
-45559,13 |
-6,662 |
-2,597 |
9,093 |
-4,630 |
-10,361 |
5,547 |
24 |
1,662 |
401,43 |
1,332 |
0,513 |
13,924 |
0,133 |
119,540 |
34963 |
25,037 |
0,85 |
-46629,51 |
-6,622 |
-2,510 |
8,816 |
-4,566 |
-10,973 |
4,855 |
25 |
1,548 |
427,47 |
1,390 |
1,187 |
13,924 |
0,132 |
137,258 |
38586 |
27,034 |
0,87 |
-48737,89 |
-6,568 |
-2,518 |
9,352 |
-4,543 |
-11,196 |
5,527 |
26 |
1,349 |
435,45 |
1,394 |
1,372 |
13,446 |
0,198 |
116,706 |
37256 |
28,033 |
1,00 |
-49709,30 |
-6,727 |
-2,954 |
7,714 |
-4,840 |
-10,027 |
3,355 |
27 |
1,775 |
421,42 |
1,452 |
1,302 |
13,445 |
0,200 |
120,216 |
35363 |
27,034 |
0,87 |
-48639,18 |
-6,780 |
-2,942 |
7,562 |
-4,861 |
-10,073 |
3,668 |
28 |
1,956 |
328,38 |
1,281 |
0,763 |
13,276 |
0,114 |
92,524 |
24667 |
20,045 |
0,85 |
-38920,18 |
-6,775 |
-2,892 |
6,000 |
-4,833 |
-9,405 |
3,405 |
29 |
1,585 |
342,41 |
1,255 |
1,102 |
13,276 |
0,148 |
95,753 |
26366 |
21,043 |
1,00 |
-39990,78 |
-6,726 |
-2,848 |
6,040 |
-4,787 |
-9,886 |
3,413 |
30 |
1,817 |
356,44 |
1,231 |
1,588 |
13,276 |
0,123 |
98,816 |
27990 |
22,041 |
0,87 |
-41061,30 |
-6,692 |
-2,818 |
5,839 |
-4,755 |
-10,339 |
3,412 |
31 |
1,745 |
370,46 |
1,211 |
2,005 |
13,276 |
0,127 |
101,852 |
29614 |
23,040 |
1,00 |
-42131,81 |
-6,674 |
-2,804 |
5,943 |
-4,739 |
-10,624 |
3,408 |
32 |
1,751 |
384,49 |
1,192 |
2,422 |
13,276 |
0,124 |
104,880 |
31205 |
24,038 |
0,88 |
-43202,32 |
-6,662 |
-2,795 |
5,928 |
-4,729 |
-11,235 |
3,407 |
33 |
1,815 |
398,52 |
1,176 |
2,840 |
13,276 |
0,121 |
107,905 |
32800 |
25,037 |
1,00 |
-44272,83 |
-6,655 |
-2,789 |
6,160 |
-4,722 |
-11,684 |
3,406 |
34 |
1,618 |
356,44 |
1,230 |
1,420 |
13,557 |
0,144 |
92,273 |
28274 |
22,041 |
1,00 |
-41061,36 |
-7,172 |
-2,857 |
6,204 |
-5,014 |
-10,371 |
3,384 |
35 |
1,574 |
404,48 |
1,275 |
2,496 |
13,401 |
0,199 |
96,369 |
33194 |
26,035 |
0,88 |
-45211,74 |
-6,586 |
-2,854 |
6,211 |
-4,720 |
-10,412 |
3,284 |
36 |
1,850 |
390,45 |
1,324 |
2,427 |
13,276 |
0,200 |
100,248 |
31175 |
25,037 |
1,00 |
-44141,30 |
-6,716 |
-2,869 |
5,375 |
-4,793 |
-10,089 |
3,649 |
|
Log (IT) |
MW |
D |
LogP |
Eb |
ChM |
Es |
Ee |
ShA |
ShC |
Et |
EHOMO |
ELUMO |
µ |
χ |
TNC |
Ea |
Log (IT) |
1 |
|
|
|
|
|
|
|
|
|
|
|
|
|
|
|
|
MW |
-0,143 |
1 |
|
|
|
|
|
|
|
|
|
|
|
|
|
|
|
D |
-0,214 |
0,160 |
1 |
|
|
|
|
|
|
|
|
|
|
|
|
|
|
LogP |
0,244 |
0,402 |
-0,683 |
1 |
|
|
|
|
|
|
|
|
|
|
|
|
|
Eb |
-0,252 |
0,463 |
0,261 |
-0,206 |
1 |
|
|
|
|
|
|
|
|
|
|
|
|
Char. |
-0,087 |
0,300 |
0,386 |
0,166 |
-0,124 |
1 |
|
|
|
|
|
|
|
|
|
|
|
Es |
-0,039 |
0,442 |
0,356 |
-0,210 |
0,435 |
-0,009 |
1 |
|
|
|
|
|
|
|
|
|
|
Ee |
0,210 |
-0,044 |
-0,313 |
0,453 |
-0,166 |
0,282 |
-0,558 |
1 |
|
|
|
|
|
|
|
|
|
ShA |
-0,128 |
0,995 |
0,150 |
0,450 |
0,416 |
0,374 |
0,408 |
0,002 |
1 |
|
|
|
|
|
|
|
|
ShC |
0,112 |
0,037 |
-0,229 |
0,248 |
-0,334 |
0,065 |
-0,038 |
0,106 |
0,055 |
1 |
|
|
|
|
|
|
|
Et |
0,189 |
-0,965 |
-0,381 |
-0,162 |
-0,528 |
-0,302 |
-0,519 |
0,167 |
-0,949 |
0,019 |
1 |
|
|
|
|
|
|
EHOMO |
-0,049 |
0,371 |
0,102 |
0,057 |
0,300 |
0,050 |
0,643 |
-0,353 |
0,363 |
-0,219 |
-0,366 |
1 |
|
|
|
|
|
ELUMO |
-0,151 |
0,165 |
-0,334 |
0,225 |
0,409 |
-0,243 |
-0,335 |
0,330 |
0,144 |
-0,095 |
-0,096 |
-0,194 |
1 |
|
|
|
|
µ |
-0,237 |
0,340 |
0,537 |
-0,560 |
0,686 |
-0,091 |
0,474 |
-0,412 |
0,281 |
-0,268 |
-0,503 |
0,338 |
-0,014 |
1 |
|
|
|
χ |
-0,170 |
0,357 |
-0,264 |
0,245 |
0,552 |
-0,205 |
0,028 |
0,124 |
0,333 |
-0,209 |
-0,290 |
0,355 |
0,848 |
0,169 |
1 |
|
|
TNC |
0,013 |
-0,614 |
0,516 |
-0,618 |
-0,408 |
0,336 |
-0,134 |
-0,071 |
-0,582 |
-0,003 |
0,477 |
-0,229 |
-0,498 |
-0,059 |
-0,598 |
1 |
|
Ea |
-0,240 |
0,158 |
0,183 |
-0,209 |
0,640 |
-0,169 |
-0,010 |
0,210 |
0,115 |
-0,317 |
-0,213 |
0,049 |
0,619 |
0,426 |
0,616 |
-0,296 |
1 |

Modeling the inhibition of tumor cells log(IT) value of all training compounds (5-N-substituted 2-(substituted benzenesulphonyl) glutamines) led to the best value corresponding to the linear combination of the following descriptors: Partition Coefficient logP, Mulliken charges ChM, steric energy Es, dipole moment μ , absolute electronegativity χ, total negative charges of the molecule TNC, activation energy Ea.
The most significant QSAR model was obtained, as shown in the following equation:
log(IT) = 2,34+0,45 logP-7,03 ChM+1,57 10-03 Es+8,08 10-02 μ-0,66 χ+0,46 TNC+0,15 Ea (5)
For our 30 compounds, the correlation between experimental and calculated log(IT) one based on this model are quite significant (Figure 3) as indicated by statistical values:
N = 30 R2 = 0.626 > 0.6 = 0.606 = 0.184 F=5.255 RMSE = 0.134 P < 0.0001
In the above regression equation, N is number of compounds, R is correlation coefficient, F is Fisher’s test, RMSE is root mean square error and P is the significance level. Generally, the higher the correlation coefficient and the lower the standard error, the more reliable is the model. High values of F and P is much smaller than 0.05 indicate the significance of Eq. (5), which reflects the ratio of variance explained by the model and the variance due to the error in the model. Based on Eq. (5), the positive correlation coefficient for logP, Es, μ TNC and Ea indicates that a compound with a larger value for these descriptors would have a larger log(IT) value (increase inhibition of tumor cells), the negative correlation for ChM and χ indicate that a compound with a larger value for these descriptors would have a smaller log(IT) value (decrease inhibition of tumor cells).
The correlations of predicted and observed activities and the residual values are illustrated in Figure 3.
The figure 3 shows a very regular distribution of Log (IT) values depending on the experimental values.
As part of this conclusion, we can say that the inhibition of tumor cells Log(IT) values obtained from MLR are good correlated to that of the observed values.
In this work, variance inflation factors (VIF) was calculated to test if multicollinearities existed among the descriptors which is defined as

In order to distinguish the importance of each descriptor on antitumor of glutamines, standard regression coefficients (SR) and t test values of the seven descriptors are also listed in Table 4. As shown in Table 4, the absolute value of SR and t test value of log P are 0.386 and 5.027, respectively, both larger than the other descriptors, which indicates that in this QSAR model, the influence of LogP on antitumor cells is stronger than that of the others.
Descriptor |
VIF |
SR |
t test value |
LogP |
8,780 |
0,386 |
5,027 |
ChM |
2,499 |
0,206 |
-4,694 |
Es |
1,789 |
0,174 |
3,004 |
μ |
3,177 |
0,232 |
1,859 |
χ |
2,496 |
0,206 |
-2,159 |
TNC |
8,558 |
0,382 |
4,498 |
Ea |
3,051 |
0,228 |
2,551 |
** Partition coefficient (LogP) appeared as the most significant positively descriptor for the derived QSAR model. Glutamine compounds with higher lipophilicity are more likely to give better anticancer activity [19].
** Total negative charges TNC has a positive sign in the model, So, glutamine compounds with lower TNC have stronger electrondonating groups on phenyl rang, marginally contributing to the activity [18].
** The dipole moment μ has a positive sign in the model, which suggests that increased activity can be achieved by increasing the polarity of the glutamine derivatives [22].
** The inhibitory tumor activity is varies positively with the activation energy Ea of the substituted glutamines. Activation energy Ea is influencing by the temperature of the system and the energy of repulsion between the reacting centers.
** Steric energy Es has a positive sign in the model, it dependents to the steric effect of substituent groups of glutamines, the bulk or small groups are possibly contributing to the activity.
The descriptors proposed in Eq. (5) by MLR were, therefore, used as the input parameters in the Multiples nonlinear regression (MNLR) and artificial neural network (ANN).
The resulting equation is:
log (IT) = -89,94+0,53 LogP+3,89 ChM+3,63E-03 Es+0,97 μ-39,69 χ+1,34 TNC-0,32 Ea+9,43 10-3 (LogP)2-36,99 (ChM)2- 4,50 10-6 (Es)2-6,35 10-2 x (μ)2-4,06 (χ)2+3,85 x 10⁻² (TNC)2+8,11 10-2 (Ea)2 (7)
N = 30 R2 = 0.792 > 0.6 = 0.698 = 0.137 RMSE = 0.121
The correlations of predicted and observed activities and the residual values are illustrated in Fig. 4.


The correlations coefficients and Standard Error of Estimate, obtained with the ANN, show that the selected descriptors by MLR are pertinent and that the model proposed to predict the anticancer activity is relevant.
The correlation between ANN calculated and experimental activities and the residues values are very significant as illustrated in Fig. 5 and as indicated by R and R2 values.
The values of predicted activities calculated using ANN and the observed values are given in Table 6.
N = 30 R2 = 0.828 > 0.6 = 0.658 = 0.175 RMSE=0.0041
True predictive power of a QSAR model is to test their ability to predict accurately the anticancer activity of glutamine compounds from an external test set: 6-9-16-24-27-35, (compounds which were not used for the model development).
The comparison of the values of log (IT-test) to log (ITobs) shows that a good prediction has been obtained for the 6 compounds. The main performance parameters of the three models are shown in table 5.
Table 5:- Performance comparison between models obtained by MLR, RNLM and ANN
Leave many-out cross-validation |
test set |
|||
N |
Q2 |
N |
R2test |
|
MLR |
30 |
0.636 |
6 |
0.662 |
MNLR |
30 |
0.604 |
6 |
0.69 |
ANN |
30 |
0.76 |
6 |
0.821 |
The critical leverage h* is fixed at (3P+1)/N or P and N are respectively the number of descriptors and number of compounds of training set. If h>h*, the prediction of the compound can be considered as unreliable and vice versa. As illustrated in the Williams graph of Figure. 6, excepting thate compounds 6, 9 and 24 are outside (has standardized residual less or more than standard deviation units ), the majority of the molecules in the training and test sets (91.66%) fall within the applicability chemical domain and then the predicted inhibitory activity by the developed QSAR model is reliable

In this test, random RML, RNLM and ANN models are generated by randomly shuffling the dependent variable while keeping the independent variables as it is. The new QSAR models are expected to have significantly low R2 and Q2 values for several trials, which confirm that the developed QSAR models are robust and the results of the RML, RNLM and ANN methods are not due to a chance correlation of the training set.
A comparison of the quality of MLR, MNLR and ANN models shows that the ANN is the best models that indicate the effects of these descriptors on the biological activity of the studied compounds.
Iteration |
MLR |
MNLR |
ANN |
|||
Q2 |
R2 |
Q2 |
R2 |
Q2 |
R2 |
|
1 |
0.421 |
0.54 |
0.435 |
0.476 |
0.435 |
0.44 |
2 |
0.347 |
0.407 |
0.389 |
0.39 |
0.279 |
0.53 |
3 |
0.291 |
0.301 |
0.279 |
0.321 |
0.299 |
0.371 |
4 |
0.161 |
0.251 |
0.198 |
0.254 |
0.223 |
0.451 |
5 |
0.369 |
0.464 |
0.317 |
0.592 |
0.217 |
0.364 |
N° |
Log(IT) |
||||||
Obs. |
RML |
MNLR |
ANN |
||||
Pred. |
Resid. |
Pred. |
Resid. |
Pred. |
Resid. |
||
1 |
1,722 |
1,713 |
0,009 |
1,709 |
0,013 |
1,682 |
0,040 |
2 |
1,699 |
1,793 |
-0,094 |
1,725 |
-0,026 |
1,775 |
-0,076 |
3 |
1,398 |
1,499 |
-0,101 |
1,277 |
0,121 |
1,443 |
-0,045 |
4 |
1,574 |
1,546 |
0,028 |
1,638 |
-0,064 |
1,489 |
0,085 |
5 |
1,837 |
1,650 |
0,187 |
1,718 |
0,119 |
1,632 |
0,205 |
6* |
1,398 |
1,916 |
-0,518 |
1,999 |
-0,601 |
1,402 |
-0,004 |
7 |
1,699 |
1,770 |
-0,071 |
1,753 |
-0,054 |
1,704 |
-0,005 |
8 |
1,796 |
1,751 |
0,045 |
1,737 |
0,059 |
1,686 |
0,110 |
9* |
1,796 |
1,403 |
0,393 |
1,319 |
0,477 |
1,758 |
0,038 |
10 |
1,079 |
1,360 |
-0,281 |
1,250 |
-0,171 |
1,317 |
-0,238 |
11 |
1,519 |
1,539 |
-0,020 |
1,565 |
-0,046 |
1,443 |
0,076 |
12 |
1,519 |
1,673 |
-0,154 |
1,529 |
-0,010 |
1,568 |
-0,049 |
13 |
1,779 |
1,626 |
0,153 |
1,727 |
0,052 |
1,745 |
0,034 |
14 |
1,784 |
1,783 |
0,001 |
1,782 |
0,002 |
1,745 |
0,039 |
15 |
1,828 |
1,746 |
0,082 |
1,772 |
0,056 |
1,750 |
0,078 |
16* |
1,695 |
1,542 |
0,153 |
1,625 |
0,070 |
1,630 |
0,065 |
17 |
1,611 |
1,646 |
-0,035 |
1,638 |
-0,027 |
1,583 |
0,028 |
18 |
1,432 |
1,334 |
0,098 |
1,356 |
0,076 |
1,297 |
0,135 |
19 |
1,431 |
1,491 |
-0,060 |
1,487 |
-0,056 |
1,412 |
0,019 |
20 |
1,617 |
1,506 |
0,111 |
1,481 |
0,136 |
1,456 |
0,161 |
21 |
1,396 |
1,431 |
-0,035 |
1,472 |
-0,076 |
1,452 |
-0,056 |
22 |
1,774 |
1,521 |
0,253 |
1,590 |
0,184 |
1,579 |
0,195 |
23 |
1,576 |
1,399 |
0,177 |
1,517 |
0,059 |
1,420 |
0,156 |
24* |
1,662 |
1,301 |
0,361 |
1,313 |
0,349 |
1,595 |
0,067 |
25 |
1,548 |
1,672 |
-0,124 |
1,611 |
-0,063 |
1,663 |
-0,115 |
26 |
1,349 |
1,522 |
-0,173 |
1,527 |
-0,178 |
1,533 |
-0,184 |
27* |
1,775 |
1,509 |
0,266 |
1,530 |
0,245 |
1,642 |
0,133 |
28 |
1,956 |
1,949 |
0,007 |
1,974 |
-0,018 |
1,829 |
0,127 |
29 |
1,585 |
1,618 |
-0,033 |
1,660 |
-0,075 |
1,549 |
0,036 |
30 |
1,817 |
1,774 |
0,043 |
1,765 |
0,052 |
1,758 |
0,059 |
31 |
1,745 |
1,812 |
-0,067 |
1,843 |
-0,098 |
1,847 |
-0,102 |
32 |
1,751 |
1,736 |
0,015 |
1,784 |
-0,033 |
1,807 |
-0,056 |
33 |
1,815 |
1,757 |
0,058 |
1,880 |
-0,065 |
1,837 |
-0,022 |
34 |
1,618 |
1,726 |
-0,108 |
1,595 |
0,023 |
1,682 |
-0,064 |
35* |
1,574 |
1,604 |
-0,030 |
1,633 |
-0,059 |
1,501 |
0,073 |
36 |
1,850 |
1,759 |
0,091 |
1,745 |
0,105 |
1,736 |
0,114 |
From the values of correlation coefficient of the six compounds (test set), the Cross-Validated coefficient (training set) and other statistical parameters of these methods (MLR, MNLR and ANN), it is clear that the predictive power of our models are equally robust and stable, andit can be efficiently used for estimating the antitumor activity of other some glutamine compounds for which no experimental data are available.
The predicted antitumor activity values of 5-N-substituted- 2-(substituted benzenesulphonyl) glutamines compounds of training set, obtained by different methods are listed in table 76 along with their observed activity.
Table 7:- Observed, predicted Log(IT) and residue according to different methods.
The present study shows that molecular descriptors, namely the partition coefficient logP, Mulliken charges ChM, steric energy Es, dipole moment μ, absolute electronegativity χ, total negative charges of the molecule TNC, activation energy Ea, are useful for the prediction of the best % Inhibition of Tumor cells of 5-N-substituted-2-(substituted benzenesulphonyl) glutamines compounds, for which the experimental data are unavailable. The QSAR model is statistically significant, robust and can be used for prediction the activity more accurately, and it may be helpful for a better understanding of the anticancer activity of this class of compounds and useful as guidance to estimate the antitumor cells as biological activity of new glutamine compounds.
- Kamal, G Balakishan, G Ramakrishna, T B Shaik, K Sreekanth, M Balakrishna, et al. Synthesis and biological evaluation of cinnamido linked pyrrolo[2,1-c][1,4]benzodiazepines as antimitotic agents. Eur J Med Chem. 2010;45(9):3870-3884. doi: 10.1016/j.ejmech.2010.05.041
- Ousaa, B Elidrissi, M Ghamali, S Chtita, M Bouachrine, T Lakhlifi. Acute toxicity of halogenated phenols: Combining DFT and QSAR studies. JCMMD. 2014;4(3):10-18.
- Advanced Chemistry DevelopmentInc. Toronto,Canada. 2009.
- Efron, J Am. Estimating the error rate of a prediction rule: improvement on cross-validation. Stat. Assoc.1983;78(382):316-331.
- Elidrissi, A Ousaa, M Ghamali, S Chtita, M A Ajana, M Bouachrine, et al. Combining DFT and QSAR result for predicting the biological activity of 1-(2-ethoxyethyl)-1H-pyrazolo[4,3-d]pyrimidines as phosphodiesterase V inhibitors. JCMMD. 2014;4(4):140-149.
- Elidrissi, A Ousaa, M Ghamali, S Chtita, M A Ajana, M Bouachrine, et al. The acute toxicity of nitrobenzenes to Tetrahymena pyriformis: Combining DFT and QSAR studies. MJC. 2015;3(4): 848-860.
- Elidrissi, A Ousaa, M Ghamali, S Chtita, M A Ajana, M Bouachrine, et al.The biological activity of pyrazinecarboxamides derivatives as an herbicidal agent: combining DFT and QSAR studies. JCMMD. 2015;5(2):83-91.
- Costa, JF Huneau, D Tome. Characteristics of L-glutamine transport during Caco-2 cell differentiation. Biochim Biophys Acta. 2000;1509(1-2):95-102.
- Lee, W Yang, RG Par. Development of the Colle-Salvetti correlation-energy formula into a functional of the electron density. Phys Rev B Condens Matter. 1988;37(2):785-789.
- C Rücker, G Rücker, M Meringer. y-Randomization and its variants in QSPR/QSAR. J Chem Inf Model. 2007;47(6):2345-2357.
- Ivan, L Crisan, S Funar-Timofei, M Mracec. A quantitative structure–activity relationships study for the anti-HIV-1 activities of 1- (2-hydroxyethoxy)methyl-6-(phenylthio)thymine derivatives using the multiple linear regression and partial least squares methodologies. J Serb Chem Soc. 2013;78(4):495-506.
- J W Blum, R E Speece. Quantitative structure-activity relationships for chemical toxicity to environmental bacteria. Ecotoxicol Environ Saf. 1991;22(2):198-224.
- D Wang, Y Yuan, S Duan, R Liu, S Gu, S Zhao, et al.QSPR study on melting point of carbocyclic nitroaromatic compounds by multiple linear regression and artificial neural network. Chem Inte Labo Sys. 2015;143:7-15. DOI: 10.1016/j.chemolab.2015.02.009
- DW Osten. Selection of optimal regression models via cross-validation. J Chemom. 1998; 2(1):39-48. DOI: 10.1002/cem.1180020106
- Estrada. On the Topological Sub-Structural Molecular Design (TOSS-MODE) in QSPR/QSAR and Drug Design Research. SAR QSAR Environ Res. 2000;11(1):55-73. DOI: 10.1080/10629360008033229
- R Burden, D A Winkler. A quantitative structure--activity relationships model for the acute toxicity of substituted benzenes to Tetrahymena pyriformis using Bayesian-regularized neural networks. Cem Res Toxicol. 2000;13(6):436-40.
- Zalkin, JL Smith, JL Enzymes utilizing glutamine as an amide donor. Adv Enzymol Relat Areas Mol Biol. 1998;72:87-144.
- HJ Zhang, JY Zhang, YM Zhu. In vitro investigations for the QSAR mechanism of lymphocytes apoptosis induced by substituted aromatic toxicants. Fish Shellfish Immunol. 2008;25(6):710-7. doi: 10.1016/j.fsi.2008.02.008
- McKim , P Schmieder , G Veith. Absorption dynamics of organic chemical transport across trout gills as related to octanol-water partition coefficient. Toxicol Appl Pharmacol. 1985;77(1):1-10.
- JF Niu , G Yu. Molecular structural characteristics governing biocatalytic oxidation of PAHs with hemoglobin. Environ Toxicol Pharmacol. 2004;18(1):39-45. doi: 10.1016/j.etap.2004.05.002
- Roy, I Mitra, S Kar, PK Ojha, RN Das, H Kabir. Comparative studies on some metrics for external validation of QSPR models. J Chem Inf Model. 2012;52(2):396-408. doi: 10.1021/ci200520g
- Roy, S Kar, P Ambure. On a simple approach for determining applicability domain of QSAR models. Chem Intel Labor Syst. 2015;145:22-29. doi.org/10.1016/j.chemolab.2015.04.013
- Srikanth, B Debnath. Syntheses, biological evaluation and QSAR study on antitumor activity of 1, 5-N, N′-disubstituted-2-(substituted benzenesulphonyl) glutamamides. Bioorg Med Chem. 2002;10(6):1841-1854.
- K Srikanth, Ch Anil Kumar, B Ghosh,T Jha. Synthesis, screening and quantitative structure–activity relationship (QSAR) studies of some glutamine analogues for possible anticancer activity. Bioorg Med Chem. 2002;10(7):2119-2131.
- Goodarzi, M P Freitas, R Jensen. Ant colony optimization as a feature selection method in the QSAR modeling of anti-HIV-1 activities of 3-(3, 5-dimethylbenzyl) uracil derivatives using MLR, PLS and SVM regressions. Chemom Intell Lab Syst.2009;98(2):123-129. doi.org/10.1016/j.chemolab.2009.05.005
- H Fatemi, H Malekzadeh. Prediction of log(IGC50)-1 for benzene derivatives to ciliate tetrahymena pyriformis from their molecular descriptors. Bull Chem Soc Jpn. 2010;83(3):233-245. DOI: 10.1246/bcsj.20090213
- M T D Cronin, B W Gregory, T W Schultz. Quantitative Structure−Activity Analyses of Nitrobenzene Toxicity to Tetrahymena pyriformis. Chem Res Toxicol. 1998;11(8):902-8. DOI: 10.1021/tx970166m
- MA Efroymson, A Ralston, HS Wilf. Multiple Regression Analysis in Mathematical Methods for Digital Computers. Eds,Wiley NewYork. 1960.
- M J Frisch and al., Gaussian 03, M J Revision B 01, Gaussian, Inc., Pittsburgh, PA . 2003.
- Medina, M J Nutr., 131 (2001), 2539-2542.
- P K Ojha, I Mitra, R Das, K Roy. Further exploring rm2 metrics for validation of QSPR models. Chemom Intell Lab Syst.2011;107:194-205. doi.org/10.1016/j.chemolab.2011.03.011
- P Y Lee, C Y J Chen. Impact of cadmium on the bacterial communities in the gut of Metaphire posthuma. J Hazard Mater. 2009;172(2-3):1212-1217. doi: 10.1016/j.jhazmat.2009.07.126
- Q Shen, J H Jiang, C X Jiao, G L Shen, R Q Yu. Modified particle swarm optimization algorithm for variable selection in MLR and PLS modeling: QSAR studies of antagonism of angiotensin II antagonists. Eur J Pharm Sci. 2004;22(2-3):145-52. DOI: 10.1016/j.ejps.2004.03.002
- R Hmamouchi, M Larif, A Adad, M Bouachrine, T Lakhlifi. Structure activity and prediction of biological activities of compound (2-methyl-6-phenylethynylpyridine) derivatives relationships rely on electronic and topological descriptors. JCMMD. 2014;4(3):61-71.
- S Chtita,M Larif, M Ghamali, A Adad, R Hmamouchi, M Bouachrine, et al. Studies of two different cancer cell lines activities (MDAMB-231 and SK-N-SH) of imidazo[1,2-a]pyrazine derivatives by combining DFT and QSAR results. IJIRSET. 2013;2(11):6586-6601.
- U Sarkar, R Parthasarathi, V Subramanian, P K Chattaraji. Toxicity analysis of polychlorinated dibenzofurans through global and local electrophilicities. J Mol Struct. THEOCHEM. 2006;758(2-3):119–125. doi.org/10.1016/j.theochem.2005.10.021

