


Letter to Editor
Open Access
Dirty Downstream Ganges: What Fate is
Waiting?
Abhijit Mitra*
Department of Marine Science, University of Calcutta, 35, B. C. Road, Kolkata-700 019, India
*Corresponding author: Abhijit Mitra, Department of Marine Science, University of Calcutta, 35, B. C. Road, Kolkata-700 019, India, E-mail: @
Received: August 15, 2016; Accepted: September 19, 2016; Published: September 21, 2016
Citation: Mitra A (2016) Dirty Downstream Ganges: What Fate is Waiting?. Int J Marine Biol Res 1(2): 1-4. DOI: http://dx.doi.org/10.15226/24754706/1/2/00104
The Hugli estuary, in the extreme western part of the lower
Gangetic delta in the downstream region is a major estuary of
the tropics. It is adjacent to the highly urbanized city of Kolkata,
Howrah and the newly emerging Haldia port-cum-industrial
complex. The selected sampling station (marked in yellow
square) is 2.8 km off Sagar island (the triangular big island on
the middle of the map), which is almost at the confluence of
the Hugli estuary and the Bay of Bengal (Figure 1). This area
has been selected as the test bed of the present study owing (i)
presence of multifarious industries that are the point sources
of zinc, copper and lead (ii) continuous plying of fishing vessels
and trawlers that use antifouling paints for conditioning, whose
main ingredients are zinc, copper and lead (non-point sources)
(iii) presence of brick kilns, industries and thickly populated city
of Kolkata, Howrah and the Haldia port-cum-industrial complex
that serve as the primary sources of carbon dioxide at the local
level and (iv) a major navigational channel in the region.

Figure 1: Sampling station (marked in yellow square) in the Hugli estuary
Data Bank
A number of studies on different aspects of the lower Gangetic
delta complex have been published over the years, which include
description of the data (and methods) at different times over the
past three decades [1-10]. Real time data were also collected
simultaneously since 1998 from the sampling site during high
tide condition to assure quality and continuity to the data bank.
Finally time series analysis was performed to forecast the trend
of selected variables on the basis of the past 30 years’ realtime
data. Exponential smoothing method produces maximum
likelihood estimates and can reflect the future trend of the
selected variables. This approach was used to forecast the values
for aquatic pH and selected heavy metals (Zn, Cu and Pb) in the
ambient media of the sampling station till 2043. Predictions of
the selected variables were carried out (using statistical models)
to see the future of the region after 30 years.
Gangetic Delta Water: Present and Future
Surface water pH
The surface water pH exhibited variation within a small
range. The lowest and highest pH values were 8.27 (in 2013)
and 8.34 (in 1984) respectively (Figure 2). The forecast method
predicts the pH value to be 8.28 during 2043 (Figure 3).
Dissolved metal
The order of dissolved heavy metals in the estuarine water
is zinc > copper > lead. In the selected station, zinc ranged from
234.29 ppm (in 1984) to 501.90 ppm (in 2013) (Figure 4),
dissolved Copper ranged from 50.95 ppm (in 1984) to 264.00
ppm (in 2013) (Figure 5) and dissolved lead ranged from
8.59 ppm (in 1984) to 43.83 ppm (in 2013) (Figure 6). All the
dissolved metals exhibit an increasing trend. It is also predicted
that dissolved zinc, copper and lead will touch 698.98 ppb 497.65
ppb and 76.60 ppb respectively after a period of 30 years (Figures
7, 8, 9).
Biologically Available Sediment (BAS) metal
In the sediment compartment, the biologically available
heavy metals exhibited a decreasing trend with time. During the

Figure 2: Temporal variation of surface water pH.
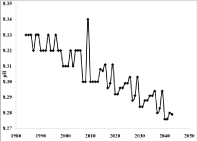
Figure 3: Forecast values of surface water pH.
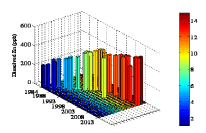
Figure 4: Temporal variation of dissolved Zinc.

Figure 5: Temporal variation of dissolved Copper.

Figure 6: Temporal variation of dissolved Lead.

Figure 7: Forecast values of dissolved zinc.

Figure 8: Forecast values of dissolved copper.

Figure 9: Forecast values of dissolved lead.
study span of 30 years, the values of zinc decreased from 92.75
ppm (in 1984) to 42.44 ppm (in 2013) (Figure 10). For copper,
the values decreased from 32.49 ppm (in 1984) to 12.05 ppm
(in 2013) (Figure 11) and for lead, the values decreased from
20.47 ppm (in 1984) to 3.88 ppm (in 2013) (Figure 12). It is also
predicted that the values will touch 7.63 ppm for biologically
available sediment zinc and practically nil for both copper and
lead during 2043 (Figures 13, 14, 15).
Climate Induced Dirtiness?
In the marine and estuarine compartments, heavy metals
originate from both natural and anthropogenic sources. It is
to be noted in this context that the industrial sources of heavy
metals have not increased during the last two decades in the
region, but the concentrations of dissolved heavy metals have
increased substantially in the estuarine system. This can be
confirmed from the industrial scenario around the study region,
where the diversity and production volume of the industry have
not increased substantially since last three decades. Interestingly
the same metals have significantly decreased in the surface
sediment compartment. After carefully scanning the health card
of downstream Ganga water. The aquatic pH, however, decreased
as seen from the present data set, and thus it can be confirmed
that acidification of estuarine water is a plausible reason of
dissolution of heavy metals from the sediment compartment
to the aquatic phase as evidenced by the significant inverse
relationships between the respective dissolved and biologically
available heavy metals in sediment. The aquatic pH is the
main player behind the transference of heavy metals from the
underlying sediment to overlying water column.

Figure 10: Temporal variation of sediment zinc.

Figure 11: Temporal variation of sediment copper.

Figure 12: Temporal variation of sediment lead.

Figure 13: Forecast values of sediment zinc.
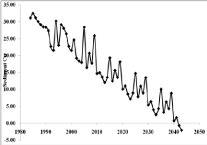
Figure 14:Forecast values of sediment Copper.

Figure 15: Forecast values of sediment lead.
Requirement for a Policy Change
Till date, the Gangetic water monitoring programme never
considered the natural forcing of climate related phenomena
in the management action plan. The present article with long
term scientific data and figures clearly points out the inclusion
of climate change related events (preferably acidification) while
developing the management policy for ecosystem restoration.
ReferencesTop
- Chakraborty SK, Choudhury A. Distribution of fiddler crabs in Sundarbans mangrove estuarine complex, India. Proceedings of National Symposium on Biology, Utilization and Conservation of Mangroves. 1985;467-472.
- Mitra A, Ghosh PB, Choudhury A. A marine bivalve Crassostrea cucullata can be used as an indicator species of marine pollution. Proceedings of National Seminar on Estuarine Management. 1987;177–180.
- Mitra A, Choudhury A. Heavy metal concentrations in oyster Crassostrea cucullata of Henry’s Island, India. Journal of Eco-biology. 1994;6(2):157-159.
- Saha SB, Mitra A, Bhattacharyya SB, Choudhury A. Heavy metal pollution in Jagannath canal, an important tidal water body of the north Sundarbans aquatic ecosystem of West Bengal. Indian Journal of Environmental Protection. 1999; 801–804.
- Banerjee K, Mitra A, Bhattacharyya DP, Choudhury A. Role of nutrients on phytoplankton diversity in the north–east coast of the Bay of Bengal. In: Ecology and Ethology of Aquatic Biota;(ed. Arvind Kumar), Daya Publishing House. 2002;102–109.
- Banerjee K, Mitra A, Bhattacharyya DP. Phytopigment level of the aquatic subsystem of Indian Sundarbans at the apex of Bay of Bengal. Sea Explorers. 2003;6:39–46.
- Mukhopadhyay SK, Biswas H, De TK, Jana TK. Fluxes of nutrients from the tropical River Hooghly at the land–ocean boundary of Sundarbans, NE Coast of Bay of Bengal, India. Journal of Marine Systems. 2006;62(1–2):9–21.
- Mitra A, Banerjee K, Sengupta K, Gangopadhyay A. Pulse of climate change in Indian Sundarbans: a myth or reality. National Academy of Science Letters. 2009;32:19-25.
- Banerjee K, Sengupta K, Raha A, Mitra A. Salinity based allometric equations for biomass estimation of Sundarban mangroves. Biomass and Bioenergy. 2013;56:382-391.
- Sengupta K, Roy Chowdhury M, Bhattacharya SB, Raha A, Zaman S, Mitra A. Spatial variation of stored carbon in Avicennia alba of Indian Sundarbans. Discovery Nature. 2013;3(8):19-24.

