


Method: The study enrolled a total of 62 patients aged between 20-62 years including 35 male (56.5%) and 27 female (43.5) patients as healthy liver donors who had normal BMI (18.2 - 25.7 kg/m2) according to Modified Dixon quantification (mDixon quant) sequence in 3 Tesla MR device. Fat content (%) and signal time value for iron (millisecond) in the liver tissue and fat content (%) in pancreas and muscle tissue were automatically quantified in the relevant areas through images. For normalization, muscle tissue was measured for the value of iron signal time. Liver segment VI, head, body and tail parts of pancreas, and two paraspinal muscles (multifidus) in the same section were quantified. Multivariate generalized linear models were used to test significant differences in fat contents and iron signal time values between age subgroups.
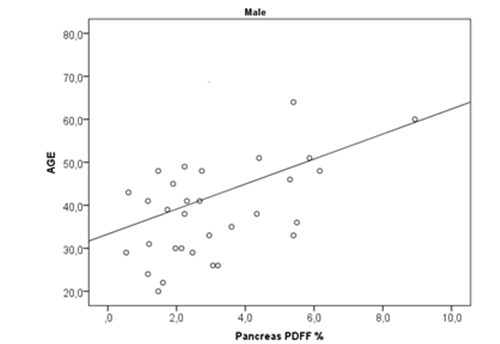
Results: Mean fat content in the liver was measured as 3.06 ± 1.06% with value of iron signal time as 23.32 ± 3.27 msec, and mean fat content in the pancreas was measured as 2.87 ± 1.67%, mean fat content in the muscle tissue as 3.62 ± 2.04% and value of iron signal time as 27.58 ± 3.16 msec. Mean liver fat content did not show a significant difference between female (2.89 ± 1.19) and male patients (3.19 ± 0.94) (p-value: 0.252 / 0.936). Differences in liver fat contents between age subgroups were not significant for female vs. male patients (2.91 ± 0.88 vs. 2.82 ± 0.90 (20- 29 years), 2.69 ± 1.77 vs. 3.24 ± 0.81 (30-39 years), 2.56 ± 1.00 vs. 3.21 ± 1.09 (40-49 years) and 3.37 ± 1.44 vs. 3.42 ± 0.99 (50-62 years). While there was a positive correlation between the age and fat contents in pancreas (r=0.385, p=0.022) and muscle (r=0.697, p=0.001) in male patients, a positive correlation was seen only between age and muscle fat content in female patients (r=0,458, p=0,016). Along with BMI values within normal range, BMI was found to be positively correlated with liver (r= 0.382, p=0.024) and muscle fat contents (r=0.380, p=0.024) only in male patients. A mild negative correlation (r=-0,420, p=0.029) and a strong negative correlation (r=-0,617, p=0.001) were seen in women and men, respectively, between mean fat content and iron signal time of liver. There was a mild positive correlation between liver fat content and muscle fat content in men (r=0,409, p= 0.015).
Conclusion: Mean MR-based liver fate content did not demonstrate a significant difference between women and men, and did not change with age in women vs. men. While the content of pancreatic and muscular fat increased in male subjects with age, only the content of muscular fat increased with age in female patients. The more BMI increased, the more the contents of liver and muscle fat increased in male patients. It was detected that iron load amount of liver became lower as the content of liver fat increased.
Key Words: Fatty Liver Disease; Hepatic Iron Overload; Liver; Magnetic Resonance Imaging
Increased pancreatic fat content may be observed in various local pathological processes such as pancreatic cancer or pancreatitis, and moreover, it is thought to develop due to reduced pancreatic volume and increased pancreatic fat content in patients particularly with metabolic diseases and impaired glucose metabolism [4-6].
Therefore, early and proper diagnosis of parenchymal chronic diseases is very important for initiation and follow-up of treatment before irreversible organ damage occurs. Biopsy is the most correct technique for diagnosis of substance accumulation syndromes and related diseases [7]. However, liver biopsy of percutaneous random sample is an invasive procedure that has pre- and post-procedure risks and may cause sampling errors particularly from hepatic metabolite beds which are heterogeneously distributed [8].
Magnetic resonance imaging (MRI) is used for detection of metabolites in parenchymal liver disease associated particularly with intrahepatic lipids and iron ions by making use of chemical shift and magnetic susceptibility effects [9]. The presence of large quantities of lipid molecules in hepatocytes causes variations in resonance frequency. Echo timing in “in-phase” and “outof- phase” states allows for the detection of lipid molecules in contrast phase images by creating areas of relative signal loss [10]. On the contrary, the presence of iron leads to overall signal loss due to local magnetic field inhomogeneities induced associated with magnetic susceptibility by ion particles causing signal loss in in-phase images compared to out-of-phase images depending on longer echo times [11]. Fat content in organs is measured this way through an imaging method called Proton density fat fraction (PDFF) measurement calculated in percentages. And iron is measured in milliseconds on the basis of T2* images calculated with increased TE times.
As PDFF and T2* values are acquired by different sequences, a method called modified DIXON has been developed to independently measure fat and iron contents in the organs with a single capture. This method scans the whole liver in a single breath-hold time and provides fat-iron quantifications in one sequence [12]. Recent studies have shown that PDFF and T2* MR imaging results through modified Dixon reconstruction have higher accuracy than standard histopathological evaluations and therefore, it is being increasingly used today for quantifying liver fat and iron [13].
Information on normal hepatic, pancreatic fat and iron content in certain age groups based on MRI might be helpful in scanning and risk prediction in liver and pancreas diseases presenting with especially substance accumulation by primarily using correct age-related reference values. Our study aimed to define reference standards of age- and gender-related liver and pancreatic fat content and values of iron signal time in normal, completely healthy donors scanned as liver donors by quantifying fat and iron content in liver as well as fat content in pancreas and muscle retrospectively in modified DIXON quant sequence with 3.0 Tesla MRI devices.
For liver fat quantification and T2* mapping, a BH 3D multiple echo GRE sequence (mDixon-Quant, Philips Medical systems, Best, the Netherlands), based on the mDixon technique, was performed using the following parameters: a 360 × 327 mm2 field of view, 144 × 131 matrix, 6 mm slice thickness (100% interpolation), 67 slices, 3-degree flip angle, 2346 ± 125 kHz receiver bandwidth, time to repetition: 5.6 msec, 6 echoes (initial time to echo: 0.95 msec, interval of TE: 0.7 msec). The sequence utilized a low flip angle, multi-echo, multi-peak method including T2* and eddy current compensation for accurate and reproducible fat quantification in a single breath hold time. mDixon-Quant (Philips Medical systems) automatically generated a fat fraction map and a T2* map. MR images of upper abdomen including hepatic, pancreatic and paraspinal muscle groups were used for this study. The images generated were assessed in work station of MR device. In PDFF and T2* images acquired from mDIXON sequence, three quantifications from liver segment VI, totally three quantifications including one from each of head, body and tail parts of pancreas and two quantifications from both paraspinal muscles (multifidus) in the same section were obtained by placing approximately 1.5 cm areas (ROI). Quantifications were acquired from areas not including the veins, bile ducts or areas with artifact in the liver parenchyma while quantifications from the pancreas were acquired by avoiding the fat around the pancreatic duct and the organ as much as possible. In these areas, PDFF values were provided in percentages and similarly, iron values were provided as T2* times in milliseconds by the device automatically (Figure 1). Moreover, by measuring T2* times and PDFF values in percentages from both paraspinal muscle groups in the same section, T2* times were compared also with liver values for normalization.

|
N |
Minimum |
Maximum |
Mean |
Std. Deviation |
AGE |
62 |
20.0 |
62.0 |
40.403 |
14.2247 |
BMI |
62 |
17.6 |
25.9 |
23.499 |
2.7680 |
LIVER fat avg |
62 |
0.3 |
5.6 |
3.064 |
1.0607 |
LIVER FE avg |
62 |
18.4 |
35.6 |
23.329 |
3.2664 |
PANC fat avg |
62 |
0.4 |
8.9 |
2.867 |
1.6665 |
muscle fat avg |
62 |
0.5 |
8.8 |
3.622 |
2.0395 |
MUSCLE FE avg |
62 |
20.5 |
34.8 |
27.585 |
3.1589 |
|
Gender |
|
||
M |
F |
|
||
LIVER fat avg |
LIVER fat avg |
P |
||
Age group |
20-29 |
2.82 ± 0.90 |
2.91 ± 0.88 |
0.598 |
30-39 |
3.24 ± 0.81 |
2.69 ± 1.77 |
0.727 |
|
40-49 |
3.21 ± 1.09 |
2.56 ± 1.01 |
0.291 |
|
>=50 |
3.42 ± 0.99 |
3.37 ± 1.44 |
0.766 |
|
|
P |
0.679 |
0.692 |
|
|
Gender |
|
||
M |
F |
|
||
PANC fat avg |
PANC fat avg |
P |
||
Age group |
20-29 |
1.92 ± 1.00 |
2.80 ± 1.45 |
0.230 |
30-39 |
3.10 ± 1.53 |
2.84 ± 1.95 |
0.768 |
|
40-49 |
2.65 ± 1.76 |
2.05 ± 1.07 |
0.875 |
|
>=50 |
4.62 ± 2.19 |
2.52 ± 0.85 |
0.013* |
|
|
P |
0.027* |
0.876 |
|
|
Gender |
|
||
M |
F |
|
||
MUSCLE fat avg |
MUSCLE fat avg |
P |
||
Age group |
20-29 |
1.58 ± 0.49 |
3.34 ± 1.69 |
0.010* |
30-39 |
2.77 ± 1.69 |
3.56 ± 2.58 |
0.488 |
|
40-49 |
3.69 ± 1.44 |
3.95 ± 1.84 |
0.758 |
|
>=50 |
4.62 ± 1.87 |
6.15 ± 2.41 |
0.208 |
|
|
P |
0.003* |
0.083 |
|

|
Gender |
|
||
M |
F |
|
||
LIVER FE avg |
LIVER FE avg |
P |
||
Age group |
20-29 |
23.91 ± 2.44 |
25.09 ± 5.37 |
0.598 |
30-39 |
21.90 ± 1.91 |
21.52 ± 2.11 |
0.727 |
|
40-49 |
24.62 ± 3.02 |
23.05 ± 2.23 |
0.291 |
|
>=50 |
22.42 ± 2.91 |
22.90 ± 2.91 |
0.766 |
|
|
P |
0.104 |
0.380 |
|

Along with BMI values within normal range in our study group, BMI was found to have a positive weak correlation with liver (r=0.382, p=0.024) and muscle fat contents (r=0.380, p=0.024) only in men. Also, there was a mild positive correlation between liver fat content and muscle fat content only in men (r=0.409, p=0.015).

Localized proton magnetic resonance spectroscopy (MRS) is also a non-invasive method that has the potential to measure hepatic triglyceride content accurately [17, 19]. However, in case of non-homogenous liver tissue, MRS causes sampling errors similar to biopsy. Today, MR Imaging is used as a new gold standard as it is able to quantify intrahepatic fat content in the liver with high accuracy [20, 21]. Unlike biopsies, this method is non-invasive and presents a representative assessment of the entire liver.
In a large study with broad participation, 95% of 345 participants who had normal BMI and no risk for fatty liver disease had less than 5.56% hepatic fat by weight with a minimum of 1.9% of tissue by weight, in MRS [22]. These values seem compliant with our PDFF values in healthy volunteers with 2.9 ± 1.2% in women and 3.19 ± 0.94% in men as mean hepatic PDFF values. Studies on patients with chronic hepatitis C who had their biopsies before therapeutic trials showed a correlation between BMI and liver steatosis [23]. However, liver steatosis did not show a significant correlation with BMI in patients with chronic hepatitis B [24]. Hines et al. [25] reported an exponential relationship between MR fat-signal fraction and BMI with IDEAL algorithm. In a study reported by Gallagher et al. [26], percentages of healthy body fat (measured with dual-energy X-ray absorptiometry) increased with age in both genders. In our study, there was a weak correlation between BMI and liver and a strong correlation between BMI and muscle fat-signal fraction in men whereas we could not find any correlations in women; however, our healthy population included only those with normal BMI.
In recent years, several MR studies have been conducted for liver fat quantification using the modified DIXON method. These studies have found fat-signal rates calculated with MR imaging and MR spectroscopy to be correlated with histopathological examinations [19, 27, 28]. DIXON method enables the onset of transverse magnetization of fat and water protons in diverse frequencies depending on echo-time allowing for separation of signal components (chemical shift), calculation of wateronly and fat-only images, and accordingly, [29], calculation of fat-signal fraction [30]. Typically, minimum two echoes are required for imaging-based fat-water separation with better detection depending on concomitant shortening of transverse magnetization or increased tissue-iron content in more echoes allowing for improved correction of effects such as T1 suppression due to longer TR, B0-field distortion or T2* [31]. In a recent study [16], mean PDFF values were ranging from 5 to 26% (mean 8.3 ± 6.2%) in correlation with histopathologic hepatosteatosis in patients without underlying liver diseases such as liver cirrhosis and hemosiderosis. In another study [32], measurement of PDFF values ranged from 0 to 23 (mean 5.72 ± 6.03%) and 0.54 to 36.45 (5.71 ± 9.00%), respectively, in women and men. In our study, PDFF value of all cases (with normal BMI) ranged from 0.3 to 5.6% (mean 2.9 ± 1.2%) and 1.6 to 5.2% (mean 3.19 ± 0.94%), respectively, in women and men. Our study chose completely healthy individuals, and PDFF value of our group was lower than that in the recent studies conducted with patients [16, 32]. Each histological steatosis degree in NAFLD (non-alcoholic fatty liver disease) was defined as follows: grade 0 (normal): < 5%; grade 1 (mild): 5 to 33%; grade 2 (moderate): 34 to 66%; and grade 3 (severe): >66% [33]. PDFF value intervals recommended in MR examinations are as follows: grade 0 (normal) [0-5%]; grade 1 (mild) [6.5-17.4%]; grade 2 (moderate) [17.5–22.1%] and grade 3 (severe) [22.2% or greater] [34].
In our study, liver iron and muscle iron values were also quantified using the DIXON imaging method. Iron build-up in the liver may be due to hereditary hemochromatosis, transfusionrelated hemochromatosis, chronic hepatopathies, etc. and furthermore, increased oxidative stress-induced exposure over time might result in cirrhosis, liver failure and hepatocellular carcinoma by damaging the liver. Like in steatosis, non-invasive detection of this build-up in the liver might relieve the patient of biopsy which is an invasive process. Among recent studies primarily comparing iron build-up in thalassemia patients with histopathological results and blood ferritin levels, a study on age-related iron build-up in a normal healthy individual would give information about metabolic progression of the patient. A normal liver has longer T2* relaxation time (greater than 20 msec for 1.5 T). It can detect the existing hepatic iron build-up at high accuracy with a strong negative correlation between liver T2* values and histological iron grade [35]. Pre-published data demonstrate a relationship between iron build-up and the presence of hepatic inflammation and fibrosis [36, 37]. Studies in the recent years reveal that T2* values have been measured to be lower particularly in the presence of steatosis [38, 39]. Besides falling within normal limits in a similar way, our study also showed that T2* values decreased as PDFF value increased (p=0.029 in women vs. p=0.001 in men). The reason is the fact that signal loss due to fat-water signal overlap in the first echo might mask or even dominate T2* signal reduction in the second echo [40]. Moreover, upper limit is below 1.5 T in 3 T devices depending on rapid signal transmission in the studies [41]. Therefore, despite the insufficient number of patients in our study, T2* ranges from 18.6 to 35.6 msec and from 18.4 to 30.6 msec in women and men, respectively. In this case, values below 20 msec as defined for 1.5 T might also be considered normal for 3 T. However, more patients should be examined for this lower limit.
Larger studies on pancreatic fat content involving more participants report inconsistent results for the relationship between pancreatic fat content and impaired glucose metabolism [42, 43]. An explanation for such heterogeneous results might be different imaging methods that are used in the assessment of pancreatic fat content, including ultrasound, computed tomography (CT) and magnetic resonance imaging (MRI) [42, 44]. Considering its non-ionizable characteristics and display of high soft tissue contrast, MRI may be particularly suitable to comprehend the role of pancreatic fat content [44]. Similarly with the liver, detection of age- and gender-related changes in pancreatic fat content in healthy population will help distinguish age- and gender-related normal results from pathological processes. Pathological processes like diabetes and metabolic diseases which might influence the pancreas of the patients have been excluded from our study, and the lack of insulin value (HOMA) data constitutes a limitation. In our study, while pancreatic fat-signal fraction showed an increase with age only in men as well as a significant difference compared to women in the elderly group, mean muscle fat-signal fraction in women was higher than men with a significant difference compared to men in the younger group. This situation implies that steatosis tends to occur outside the organ in women while the reverse seems to be true in men in the healthy normal population. We believe that this situation is rather due to sex hormones.
Our study had certain restrictions. To begin with, histopathological comparison could not be made due to ethical reasons as the study included healthy individuals. No measurement associated with breathing artifacts was performed particularly in the hepatic dome, and segment VI, owing to having highest fat content, was used for localization by taking previous studies as basis for measurements. Furthermore, in pancreas PDFF quantifications, extracellular fat areas might have been accidentally included in the calculations despite all the attention paid, particularly in cases with lower pancreatic volume.
An advantage of MRI protocol is the concomitant measurement of PDFF and T2* values in many organs such as liver, pancreas, heart, kidneys or muscles. Moreover, it allows for the calculation of indices such as total adipose tissue, visceral adipose tissue and abdominal subcutaneous adipose tissue.
- Bellentani S, Bedogni G, Miglioli L, Tiribelli C. The epidemiology of fatty liver. European journal of gastroenterology & hepatology. 2004;16(11):1087–1093.
- Browning JD, Szczepaniak LS, Dobbins R, Nuremberg P, Horton JD, Cohen JC, et al. Prevalence of hepatic steatosis in an urban population in the United States: impact of ethnicity. Hepatology. 2004;40(6):1387–1395. DOI: 10.1002/hep.20466
- Stefan N, Kantartzis K, Haring HU. Causes and metabolic consequences of Fatty liver. Endocrine reviews. 2008;29(7):939–960. doi: 10.1210/er.2008-0009
- Mathur A, Zyromski NJ, Pitt HA, Al-Azzawi H, Walker JJ, Saxena R, et al. Pancreatic steatosis promotes dissemination and lethality of pancreatic cancer. Journal of the American College of Surgeons. 2009;208(5):989–994; discussion 94–6. doi: 10.1016/j.jamcollsurg.2008.12.026
- Dong Z, Luo Y, Cai H, Zhang Z, Peng Z, Jiang M, et al. Noninvasive fat quantification of the liver and pancreas may provide potential biomarkers of impaired glucose tolerance and type 2 diabetes. Medicine. 2016;95(23):e3858. doi: 10.1097/MD.0000000000003858
- Macauley M, Percival K, Thelwall PE, Hollingsworth KG, Taylor R. Altered volume, morphology and composition of the pancreas in type 2 diabetes. PloS one. 2015;10(5):e0126825. doi: 10.1371/journal.pone.0126825
- Caldwell SH, Crespo DM. The spectrum expanded: cryptogenic cirrhosis and the natural history of non-alcoholic fatty liver disease. Journal of hepatology. 2004;40(4):578–584. DOI: 10.1016/j.jhep.2004.02.013
- Baffy G, Brunt EM, Caldwell SH. Hepatocellular carcinoma in non-alcoholic fatty liver disease: an emerging menace. Journal of hepatology. 2012;56(6):1384–1391. doi: 10.1016/j.jhep.2011.10.027
- Clavien PA, Petrowsky H, DeOliveira ML, Graf R. Strategies for safer liver surgery and partial liver transplantation. The New England journal of medicine. 2007;356(15):1545–1559. DOI: 10.1056/NEJMra065156
- Buxton RB, Wismer GL, Brady TJ, Rosen BR. Quantitative proton chemical-shift imaging. Magnetic resonance in medicine: official journal of the Society of Magnetic Resonance in Medicine / Society of Magnetic Resonance in Medicine. 1986;3(6):881–900. Doi: 10.1002/mrm.1910030609
- Hussain HK, Chenevert TL, Londy FJ, Gulani V, Swanson SD, McKenna BJ, et al. Hepatic fat fraction: MR imaging for quantitative measurement and display—early experience. Radiology. 2005;237(3):1048–1055. DOI: 10.1148/radiol.2373041639
- Borra RJ, Salo S, Dean K, Lautamaki R, Nuutila P, Komu M, et al. Nonalcoholic fatty liver disease: rapid evaluation of liver fat content with in-phase and out-of-phase MR imaging. Radiology. 2009;250(1):130–136. doi: 10.1148/radiol.2501071934
- d'Assignies G, Ruel M, Khiat A, Lepanto L, Chagnon M, Kauffmann C, et al. Noninvasive quantitation of human liver steatosis using magnetic resonance and bioassay methods. European radiology. 2009;19(8):2033–2040. doi: 10.1007/s00330-009-1351-4
- Tannapfel A, Denk H, Dienes HP, Langner C, Schirmacher P, Trauner M, et al. [Histopathological diagnosis of non-alcoholic and alcoholic fatty liver disease. Grade 2 consensus-based guidelines]. Der Pathologe. 2010;31(3):225–237. doi: 10.1007/s00292-010-1274-5
- Hall AR, Dhillon AP, Green AC, Ferrell L, Crawford JM, Alves V, et al. Hepatic steatosis estimated microscopically versus digital image analysis. Liver international: official journal of the International Association for the Study of the Liver. 2013;33(6):926–935. doi: 10.1111/liv.12162
- Fischer MA, Nanz D, Reiner CS, Montani M, Breitenstein S, Leschka S, et al. Diagnostic performance and accuracy of 3-D spoiled gradient-dual-echo MRI with water- and fat-signal separation in liver-fat quantification: comparison to liver biopsy. Investigative radiology. 2010;45(8):465–470. doi: 10.1097/RLI.0b013e3181da1343
- Thomsen C, Becker U, Winkler K, Christoffersen P, Jensen M, Henriksen O. Quantification of liver fat using magnetic resonance spectroscopy. Magnetic resonance imaging. 1994;12(3):487–495.
- Cowin GJ, Jonsson JR, Bauer JD, Ash S, Ali A, Osland EJ, et al. Magnetic resonance imaging and spectroscopy for monitoring liver steatosis. Journal of magnetic resonance imaging: JMRI. 2008;28(4):937–945. doi: 10.1002/jmri.21542
- Longo R, Pollesello P, Ricci C, Masutti F, Kvam BJ, Bercich L, et al. Proton MR spectroscopy in quantitative in vivo determination of fat content in human liver steatosis. Journal of magnetic resonance imaging: JMRI. 1995;5(3):281–285.
- Fischer MA, Raptis DA, Montani M, Graf R, Clavien PA, Nanz D, et al. Liver fat quantification by dual-echo MR imaging outperforms traditional histopathological analysis. Academic radiology. 2012;19(10):1208–1214. doi: 10.1016/j.acra.2012.05.009
- Raptis DA, Fischer MA, Graf R, Nanz D, Weber A, Moritz W, et al. MRI: the new reference standard in quantifying hepatic steatosis? Gut. 2012;61(1):117–127. doi: 10.1136/gutjnl-2011-300155
- Szczepaniak LS, Nurenberg P, Leonard D, Browning JD, Reingold JS, Grundy S, et al. Magnetic resonance spectroscopy to measure hepatic triglyceride content: prevalence of hepatic steatosis in the general population. American journal of physiology Endocrinology and metabolism. 2005;288(2):E462– E468. DOI: 10.1152/ajpendo.00064.2004
- Conjeevaram HS, Kleiner DE, Everhart JE, Hoofnagle JH, Zacks S, Afdhal NH, et al. Race, insulin resistance and hepatic steatosis in chronic hepatitis C. Hepatology. 2007;45(1):80–87. DOI: 10.1002/hep.21455
- Ayhan Balkan, Murat Taner Gülşen, Yasemin Balkan, Seçil Kaya Çalı. Relationship between the frequency of hepatitis B virus infections and levels of serum adipokines in patients with hepatosteatosis and insulin resistance. Eur J Ther. 2017;23: 60-66. DOI: 10.5152/EurJTher.2017.20
- Hines CD, Yu H, Shimakawa A, McKenzie CA, Warner TF, Brittain JH, et al. Quantification of hepatic steatosis with 3-T MR imaging: validation in ob/ob mice. Radiology. 2010;254(1):119–128. doi: 10.1148/radiol.09090131
- Gallagher D, Heymsfield SB, Heo M, Jebb SA, Murgatroyd PR, Sakamoto Y. Healthy percentage body fat ranges: an approach for developing guidelines based on body mass index. The American journal of clinical nutrition. 2000;72(3):694–701. DOI: 10.1093/ajcn/72.3.694
- Yokoo T, Bydder M, Hamilton G, Middleton MS, Gamst AC, Wolfson T, et al. Nonalcoholic fatty liver disease: diagnostic and fat-grading accuracy of low-flip-angle multiecho gradient-recalled-echo MR imaging at 1.5 T. Radiology. 2009;251(1):67–76. doi: 10.1148/radiol.2511080666
- Kim H, Taksali SE, Dufour S, Befroy D, Goodman TR, Petersen KF, et al. Comparative MR study of hepatic fat quantification using single-voxel proton spectroscopy, two-point dixon and three-point IDEAL. Magnetic resonance in medicine: official journal of the Society of Magnetic Resonance in Medicine / Society of Magnetic Resonance in Medicine. 2008;59(3):521–527. doi: 10.1002/mrm.21561
- Ma J. Dixon techniques for water and fat imaging. Journal of magnetic resonance imaging: JMRI. 2008;28(3):543–558. doi: 10.1002/jmri.21492
- Cassidy FH, Yokoo T, Aganovic L, Hanna RF, Bydder M, Middleton MS, et al. Fatty liver disease: MR imaging techniques for the detection and quantification of liver steatosis. Radiographics: a review publication of the Radiological Society of North America, Inc. 2009;29(1):231–260. doi: 10.1148/rg.291075123
- Alabousi A, Al-Attar S, Joy TR, Hegele RA, McKenzie CA. Evaluation of adipose tissue volume quantification with IDEAL fat-water separation. Journal of magnetic resonance imaging: JMRI. 2011;34(2):474–479. doi: 10.1002/jmri.22603
- Fischer MA, Donati OF, Chuck N, Blume IN, Hunziker R, Alkadhi H, et al. Two- versus three-dimensional dual gradient-echo MRI of the liver: a technical comparison. European radiology. 2013;23(2):408–416. doi: 10.1007/s00330-012-2614-z
- Kleiner DE, Brunt EM, Van Natta M, Behling C, Contos MJ, Cummings OW, Ferrell LD, et al. Design and validation of a histological scoring system for nonalcoholic fatty liver disease. Hepatology. 2005;41(6):1313–1321. DOI: 10.1002/hep.20701
- Tang A, Tan J, Sun M, Hamilton G, Bydder M, Wolfson T, et al. Nonalcoholic Fatty Liver Disease: MR Imaging of Liver Proton Density Fat Fraction to Assess Hepatic Steatosis. Radiology. 2013;267(2):422–431. doi: 10.1148/radiol.12120896
- Beaumont M, Odame I, Babyn PS, Vidarsson L, Kirby-Allen M, Cheng HL. Accurate liver T2 measurement of iron overload: a simulations investigation and in vivo study. J Magn Reson Imaging 2009;30(2):313–320. doi: 10.1002/jmri.21835
- Martinelli AL, Filho AB, Franco RF, Tavella MH, Ramalho LN, Zucoloto S et al. Liver iron deposits in hepatitis B patients: association with severity of liver disease but not with hemochromatosis gene mutations. J Gastroenterol Hepatol 2004;19(9):1036–1041. DOI: 10.1111/j.1440-1746.2004.03410.x
- Beinker NK, Voigt MD, Arendse M, Smit J, Stander IA, Kirsch RE. Threshold effect of liver iron content on hepatic inflammation and fibrosis in hepatitis B and C. J Hepatol 1996;25(5):633–638.
- Gandon Y, Guyader D, Heautot JF, et al. Hemochromatosis: diagnosis and quantification of liver iron with gradient-echo MR imaging. Radiology. 1994;193(2):533–538. DOI: 10.1148/radiology.193.2.7972774
- O'Regan DP, Callaghan MF, Wylezinska-Arridge M, Fitzpatrick J, Naoumova RP, Hajnal JV et al. Liver fat content and T2*: simultaneous measurement by using breath-hold multiecho MR imaging at 3.0 T--feasibility. Radiology. 2008;247(2):550–557. doi: 10.1148/radiol.2472070880
- Westphalen AC, Qayyum A, Yeh BM, Merriman RB, Lee JA, Lamba A, et al. Liver fat: effect of hepatic iron deposition on evaluation with opposed-phase MR imaging. Radiology. 2007;242(2):450–455. DOI: 10.1148/radiol.2422052024
- Wood JC. Magnetic resonance imaging measurement of iron overload. Curr Opin Hematol. 2007;14(3):183–190. DOI: 10.1097/MOH.0b013e3280d2b76b
- Kuhn JP, Berthold F, Mayerle J, Volzke H, Reeder SB, Rathmann W, et al. Pancreatic Steatosis Demonstrated at MR Imaging in the General Population: Clinical Relevance. Radiology. 2015;276(1):129–136. doi: 10.1148/radiol.15140446
- Ou HY, Wang CY, Yang YC, Chen MF, Chang CJ. The association between nonalcoholic fatty pancreas disease and diabetes. PloS one. 2013;8(5):e62561. doi: 10.1371/journal.pone.0062561
- Idilman IS, Tuzun A, Savas B, Elhan AH, Celik A, Idilman R, et al. Quantification of liver, pancreas, kidney, and vertebral body MRI-PDFF in non-alcoholic fatty liver disease. Abdominal imaging. 2015;40(6):1512–1519. doi: 10.1007/s00261-015-0385-0

