


2Assistant professor, Department of population and Family health, College of Health Sciences, Jimma University, Jimma, Ethiopia
3Lecturer, School of Public Health, College of Health Sciences and Medicine, Wolaita Sodo University, Wolaita Sodo, Ethiopia
Objective: To assess nutritional status and its association with infant and young child feeding summary index among 6-23 months agechildren in Demba Gofa Woreda, SNNPR, Ethiopia.
Method: A community-based cross-sectional study design with multistage simple random sampling technique was conducted from March to May 2016 in Demba Gofa Woreda, Southern Ethiopia. The data were collected from 696 randomly selected child-mother pairs. Chi-square tests for trends and binary logistic regression for bivariate analysis and multiple logistic regressions were used for multivariable analysis to identify the association between nutritional status and infant and child feeding index terciles.
Results: The analyses revealed that 43.8% (95% CI: 40.1-47.5), 15.8% (95% CI: 13.1-18.5) and 3.5% (95% CI: 2.1-4.8) of children were stunted, underweight and wasted respectively. Two hundred eight (29.9%) infants and young children fell in the poor ICFI category and 276 (39.9%) were fell in to high feeding index category. Low feeding index tercile was positively and significantly associated with stunting and underweight respectively whereas high feeding index tercile was negatively and significantly associated with stunting and underweight respectivelyas compared to medium feeding index tercile. Children who belonged to poor feeding practice 2.4 times (AOR = 2.4 (95 % CI: 1.39-4.2) more likely to be underweight whereas children who belonged to good child feeding practice 55% (AOR = 0.45 (95 % CI: 0.27-0.75) less likely to be stunted as compared to children who belonged to medium child feeding practices.
Conclusion: Child feeding practices were not optimal. Decreasing of infant and child feeding index score and increasing of stunting, underweight and wasting prevalence when the age of children increased were observed in this study reflected that infant and child feeding practiceswere not age appropriate. Health workers and health extension workers should educate mothers on complementary feeding with demonstration of the effect of the practice on children who optimally feed.
Keywords: Infant and Young Child Feeding Practices; Infants and Young Children Feeding Summary Index; Nutritional Status of Under Two Years Children.
As the report of different studies, the prevalence of stunting is high also in the regions and woredas in Ethiopia. 44% in Southern Nation Nationalities Peoples Region, 51.4% in Tigray region, 22% in Addis Ababa, 52% in Amhara region in under 5 children [1]. The magnitude of stunting varies significantly from woreda to woreda even in the same zone in southern Region. In Gamo Gofa Zone, among children, 18.7% were stunted in Kamba Woreda [3], 45.9% were stunted in Arbaminch Zuria Woreda [4]. The distribution of stunting prevalence is also different in specific age groups. Study done in Sodo Zuria woreda, southern Ethiopia showed that prevalence of stunting was 16.7 % for infants aged 6–8 months, 33.3 % for infants aged 9–11 months and 50 % for children 12-24 months [5]. The finding of stunting prevalence in EDHS 2011 is also shows the same pattern of distribution as Sodo Zuria Woreda, 9.3% for infants aged 6-8 months; 21.4% for infants 9-11 months; 32% for children 12-17 months and 47.1% for children 18-23 months [6]. In both studies, the nutritional status is getting worse when age increase. This imply that high attention should be given for young age children because stunting is associated not only with poor physical growth, but also affect cognitive abilities that are irreversible after two years of age [7, 8]. The implication of child under nutrition that has not been corrected early is extended to the entire family and subsequent generation. Malnutrition specially stunting prevents proper brain development, which means children are less able to start school when they should, and less able to learn and perform. Adults who were undernourished in childhood earn significantly less and contribute less to economic growth. Under nutrition also reduces Gross Domestic Product in every country across the globe [6].
According to the report of the Social and Economic Impact of Child Under nutrition study in Ethiopia, 67% of the working-age population in Ethiopia is currently stunted; associated with child under nutrition, Ethiopia lost Ethiopian birr (ETB) 55.5 billion in the year 2009, which is equivalent to 16.5% of GDP and 16% of all repetitions in primary school are associated with stunting. one of the key messages in the report was “eliminating stunting in Ethiopia is a necessary step for growth and transformation”[2]. However, The critical role of feeding practices and, especially, of optimal complementary feeding practices along with continued breastfeeding among children six months and onwards to reduce young child undernutrition and mortality is well recognized [8, 10], Sub optimal feeding practices and inadequate intake of complementary food and which were below the WHO recommendations have been widely documented in Ethiopia.
Nationally in 2011, only 4% of children 6-23 months received a minimum acceptable diet. Among 6-23 months of age, 23.3% in Kamba woreda, 25.5% in Arbaminch woreda met minimum dietary diversity. Among children 6-23 months old, 25.8% in Kamba Woreda, 45% in Sidama Woreda met the recommended minimum meal frequency [4, 6, 11, 12]. In the reports, majority of children were not met the WHO recommendations of minimum meal frequency and dietary diversity. In the cross sectional study of child feeding practices assessment using summary index done among HIV exposed infants also revealed that only 36.6% of infants fell in the good feeding practices and the majority of infants feeding practices were sub optimal [13]. Despite some improved trends in the proportion of children stunted and underweight in the last 15 year in Ethiopia, the prevalence of stunting and improper child feeding practices are still high in the country. Therefore, assessment of nutritional status and its association with infant and young child feeding summary index among 6-23 months age children in the study area in particular and Ethiopia at large is important for appropriate decision making on child nutritional interventions.
Independent variables: Infant and young child feeding practices( dietary diversity, breast feeding status, meal frequency, avoiding bottle feeding, seven day food frequency score, hand washing practices),Infant and young child feeding index terciles, wealth index of the house hold, number of children in the household, Child characteristics (age, sex and mothers’ verbal report on episodes of diarrheal, cough and fever of child in the last two weeks) and Maternal characteristics (age of mother; occupation of mother; educational status of mother; body mass index of mother (BMI), Antenatal and Post natal care visit, information on child feeding).
The dietary diversity score include seven food groups which are adopted from the WHO indicators for assessing infant and young child feeding practices. Mothers were asked to report all food items and beverages given to the child during the previous day of the survey. Then, all food items and beverages consumed by the child were categorized into seven food groups as (1) grains, roots, and tubers, (2) legumes and nuts, (3) dairy products, (4) flesh foods, (5) eggs, (6) vitamin-A rich fruits and vegetables, and (7) other fruits and vegetables(10). Each group was scored 1 point, if the group received by the child, if not received by the child scored 0 point and the total score of each child is 0 to 7. Scores were assigned to reflect the age specific distributions of infants in terciles.
The seven day quasi food frequency score was a modified food group frequency and measured as “How many days in the last seven days was given [food group]?” The number of days that a food group has consumed recorded for each child with a maximum of seven days.
The list of foods summed is the same as for the 24- hour diversity score, with the exception that grains have been combined with roots/tubers. In seven day food group frequency score, each food group was scored 0 if not given to the infant in the previous week, scored +1 if given one to three days, and +2 if given four or more days in the previous week. These scores were then summed to give a possible range of 0 to 14. Based on this total score, a new score of 0-2 was assigned, reflecting the agespecific distribution.
The scoring of meal frequency was based on current feeding recommendations, according to which 6- to 8-months-old infants should receive complementary foods at least 2 to 3 times a day, 9- to 11-months-oldinfants at least 3 to 4 times a day, and 12- to 23-months-old children at least 3 to 4 times a day [17].
Scoring for hand washing practices before cooking food and before feeding child: scoring system was to assign a score of 0 for a potentially harmful practice (not washing hands) and a score of 1 for a positive (washing hands).
Poor child feeding practice: an infant and young child’s summary feeding index score belonging to lower tercile of feeding index. Medium child feeding practice: an infant and young child’s summary feeding index score belonging to middle tertcile of feeding index.
Good child feeding practices: an infant and young child’s summary feeding index score belonging to higher tercile of feeding index.
Low socioeconomic status: household which belonged to lower tercile of wealth index score.
Medium socioeconomic status: household which belonged to medium tercile of wealth index score.
High socioeconomic status: household which belonged to higher tercile of wealth index score.
Stunting: length for age < -2 z-scores of the median WHO child growth standards.
Underweight: weight for Age < -2 Z score of the median WHO child growth standards
Wasting: weight for Length < -2 Z score of the median WHO child growth standards
Socio-demographic characteristics |
Frequency(N=696) |
percent |
Maternal age in years |
|
|
15-19 years |
11 |
1.6 |
20-24 years |
108 |
15.5 |
25-29 years |
247 |
35.5 |
30 and above years |
330 |
47.4 |
Religion of mother |
|
|
Protestant |
621 |
89.2 |
Other religion of mother |
75 |
10.8 |
Ethnicity of mother |
|
|
Gofa ethinic |
667 |
95.8 |
Other ethnics |
29 |
4.2 |
Marital status of mother |
|
|
Married |
689 |
99.0 |
Divorced |
7 |
1.0 |
Educational status of mother |
|
|
Illiterate |
122 |
17.5 |
Read and write |
302 |
43.4 |
Primary and above level |
272 |
39.1 |
Occupation of mother |
|
|
House wife |
669 |
96.1 |
Other occupations |
27 |
3.9 |
Utilization of Health services |
|
|
Mothers received ANC services |
546 |
78.4 |
Mothers received PNC services |
535 |
76.9 |
Wealth index status |
|
|
Low SE status |
223 |
32 |
Medium SE status |
224 |
32.2 |
High SE status |
249 |
35.8 |
When we see infants and children age in relation to under nutrition, of the three age groups, the highest prevalence of stunting, underweight and wasting found in 12-23 months age group children and the lowest found in 6-8 months age group children (Figure 1).
Mean Z score (mean ± SD) of LAZ, WAZ and WHZ indices was-1.68 (±1.07), -0.69 (±1.1) and 0.25 (±1.2) respectively for all age groups. The distribution pattern of all three indicators mean Z score of LAZ, WAZ and WHZ across the age groups were declining when age increase(Figure 2).
Child characteristics |
Frequency(N=696) |
percent |
|
Sex of child |
|||
Male |
369 |
53 |
|
Female |
327 |
47 |
|
Total |
696 |
100 |
|
Age category of child |
|
||
6-8 Month |
194 |
27.9 |
|
9-11 Month |
147 |
21.1 |
|
12-23 Months |
355 |
51 |
|
Total |
696 |
100 |
|
Episodes of diarrhoea, fever and cough in 2 weeks before the survey |
|
|
|
Diarrhoea |
No |
567 |
81.5 |
Yes |
129 |
18.5 |
|
Total |
696 |
100 |
|
Fever |
No |
639 |
91.8 |
Yes |
57 |
8.2 |
|
Total |
696 |
100 |
|
Cough |
No |
650 |
93.4 |
Yes |
46 |
6.6 |
|
Total |
696 |
100 |
|


Among all children, 97(13.9%) children were not introduced complementary food. Forty four (22.6%) among 6-8 months age group infants, 37(25%) among 9-11 months age group infants and 16(4.5%) among 12-23 month age children were not introduced complementary food.
Proportion of infants and children obtained the highest score for the number of meal frequency that they ate in the last 24hrs were 148(76.3%), 79(53.7%) and 183(51.5%) among 6-8 months age, 9-11 months age and 12-23 months age group respectively and 140(72.2%), 64(43.5%) and 84(23.7%) among 6-8 months age, 9-11 months age and 12-23 months age group respectively for the number of food groups that they received in the last 24hrs. In both meal frequency and dietary diversity score, the highest proportion was observed in 6-8 months age group. The individual combined food-frequency score for the past seven days ranged from 0 to 12, but it was theoretically ranged from 0-14. The mean ± SD food frequency score was 4.7(±2.4) for all infants and children. The highest mean± SD observed in 12-23 months age group (5.2±2.2)) and lowest observed in 6-8 months age group (4.09±2.48) (Table 3).The food group received by the majority of children was grains, roots and tubers and the food group received by no one child was flesh foods (meat, fish, poultry and liver/organ meats) food groups in the last 24 hours and 7 days during the survey Figure 3.
Age category of child |
Nutritional status |
|||||
Length for age |
Weight for length |
Weight for age |
||||
Stunted |
LAZ ≥-2SD |
Wasted |
WHZ ≥-2SD |
Underweight |
WAZ≥2SD |
|
6-8 Month n=194 |
39(20.1) |
155(79.9) |
1(0.5%) |
193(99.5%) |
2(1%) |
192(99%) |
9-11 Month n=147 |
47(32%) |
100(68%) |
2(1.4%) |
145(98.6%) |
34(23.1%) |
113(76.9%) |
12-23 Months |
219(61.7%) |
136(38.3) |
21(6%) |
334(94%) |
74(21%) |
281(79%) |
Total N=696 |
305(43.8%) |
391(56.2) |
24(3.4%) |
672(96.6%) |
110(15.8%) |
586(84.2%) |

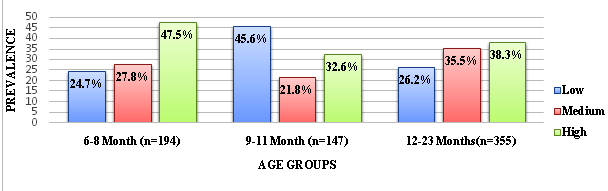
When we see the distribution of children by their feeding terciles in relation to age group, the highest proportion of infants and children fell in to high feeding index tercile was found in the younger age infants (6-8 months age) (Figure 5).The proportion of infants and children fell in to high child feeding index tercile among all age group as well as in each age group was below 50%.


Feeding practices |
All age |
Age category of child |
|||
6-8 Month (n=194) |
9-11 Month (n=147) |
12-23 Months (n=355) |
|||
Number of children received Legumes and nuts in the last 24 hours |
320(46%) |
81(41.8%) |
62(42.2%) |
177(49.9%) |
|
Number of children received any other fruits or vegetables in the last 24 hours |
53(7.6%) |
10(5.2%) |
17(11.6%) |
26(7.3%) |
|
Number of children received Egg in the last 24 hours |
179(25.7) |
45(23.2%) |
29(19.7%) |
105(29.6%) |
|
Number of children received flesh foods (meat, fish, poultry and liver/organ meats) eaten in the last 24hrs |
0(0%) |
0(0%) |
0(0%) |
0(0%) |
|
Number of children avoided Bottle feeding |
477(68.5) |
143(73.7%) |
96(65.3%) |
238(67.1%) |
|
Number of children still breastfeeding |
443(63.6) |
151(77.8%) |
88(59.8%) |
204(57.5%) |
|
Number of children received dairy products (milk, yogurt cheese) in the last 24 hours |
364(52.3) |
100(51.5%) |
76(51.7%) |
188(52.9%) |
|
Number of children received grains, rooter and tuber in the last 24 hours |
570(81.9) |
141(72.7%) |
118(80.3%) |
311(87.6%) |
|
Number of children received Vitamin A rich fruits and vegetables in the last 24 hours |
292(42% |
66(34%) |
54(36.7%) |
172(48.5%) |
|
Mean of dietary diversity score |
No of food groups |
2.55 |
2.29 |
2.41 |
2.75 |
Children not introduced Complementary food |
No of food children |
97 (13.9%) |
44 (22.6%) |
37 (25.1%) |
16(4.5%) |
Proportion of infants and children obtained the highest score for the number of meal frequency |
No of meal |
|
>=2 meals |
>= 3 meals |
>=4 meals |
Percent |
410(58.9) |
148(76.3%) |
79(53.7%) |
183(51.5%) |
|
Proportion of infants and children obtained the highest score for the number of dietary diversity score |
No of food groups |
|
≥2 food groups |
≥3 food groups |
≥4 food groups |
Percent |
288(41.4) |
140(72.2%) |
64(43.5) |
84(23.7%) |
|
Hand washing with soap/ash before preparing food |
Yes |
450(64.7) |
130(67%) |
78(53%) |
242(68.2%) |
Hand washing with soap/ash before feeding the child |
Yes |
271(38.9) |
79(40.7%) |
51(34.7%) |
141(39.7%) |
Mean of Meal frequency in the last 24 hours |
Meal number |
3.2 |
2.9 |
2.78 |
3.5 |
Mean of seven days food frequency score(not age specific score) |
Mean(±SD) |
4.7(±2.4) |
4.09(±2.48). |
4.3(±2.61) |
5.2(±2.2)) |
Mean of child feeding index |
Mean(±SD) |
6.14(±2.5) |
6.53(±2.5) |
5.48(±2.5) |
6.19 (±2.5) |
All (N=696) |
6-8 Months(n=194) |
9-11 Months (n=147) |
12-23 months(n=355) |
|||||
Components of ICFI |
|
|||||||
correlation of each component with IYCFI |
Cronbach's α value when all items included= 0.584 |
Cronbach's α value when all items included= 0.58 |
Cronbach's α value when all items included= 0.562 |
Cronbach's α value when all items included= 0.694 |
||||
Cronbach's Alpha if Item Deleted |
correlation of each component with IYCFI |
Cronbach's Alpha if Item Deleted |
correlation of each component with IYCFI |
Cronbach's Alpha if Item Deleted |
Correlation of each component with IYCFI |
Cronbach's Alpha if Item Deleted |
||
Age specific score of hand washing before feeding child |
0.525 |
0.531 |
0.336 |
0.584 |
0.635 |
0.47 |
0.583 |
0.645 |
Age specific score of hand washing before cooking food |
0.666 |
0.508 |
0.587 |
0.523 |
0.73 |
0.478 |
0.674 |
0.631 |
Age specific score of avoiding bottle feeding |
0.39 |
0.564 |
0.319 |
0.582 |
0.292 |
0.551 |
0.462 |
0.681 |
Age specific Meal frequency score |
0.751 |
0.563 |
0.865 |
0.371 |
0.806 |
0.443 |
0.805 |
0.631 |
Age specific dietary diversity score |
0.712 |
0.462 |
0.872 |
0.378 |
0.788 |
0.43 |
0.64 |
0.648 |
Age specific 7 days food frequency score |
0.754 |
0.432 |
0.802 |
0.436 |
0.825 |
0.389 |
0.77 |
0.616 |
Age specific Breast feeding score |
-0.096 |
0.705 |
-0.204 |
0.744 |
-0.233 |
0.778 |
0.02 |
0.738 |

After controlled for potential confounders, Low feeding index tercile was positively and significantly associated with stunting and underweight respectively whereas high feeding index tercile was negatively and significantly associated with stunting and underweight respectively as compared to medium feeding index tercile. There was no any association between wasting and infant and child feeding index terciles (Table 6-8).
However, many factors in bivariate analysis were significantly associated with under-nutrition, few were significantly associated with under nutrition in multivariable analysis. Mothers did not attend any formal school and being older age child were positively and significantly associated with stunting whereas mothers who had more frequent visiting of PNC clinic was significantly reduce the odds of stunting. Being male child, older age child (12-23 months age) and high number of under five children in the house were significantly associated with underweight. Diarrhoea and high number of under five children in the house were positively and significantly associated with wasting (Table 6-8).
Independent Variables |
Yes |
No |
COR |
AOR(95% C.I. for AOR) |
P. value |
|
Age category of child |
6-8 Month (Reference) |
39 |
155 |
1 |
1 |
|
9-11 Month |
47 |
100 |
1.9* |
1.2(0.6-2.2) |
0.659 |
|
12-23 Months |
219 |
136 |
6.4* |
10.5(6.0-18.3) |
< 0.000.1 |
|
Ethnicity of mother |
Other ethnic (Reference) |
8 |
21 |
1 |
1 |
|
Gofa ethnic |
297 |
370 |
2.1 |
0.99(0.34-2.9) |
0.996 |
|
Religion of mother |
Other religion (Reference) |
28 |
47 |
1 |
1 |
|
Protestant |
277 |
344 |
1.4 |
1.1(0.53-2.26) |
0.798 |
|
Maternal age |
≥20 years (Reference) |
271 |
364 |
1 |
1 |
|
maternal age 15-19 years |
34 |
27 |
1.7 |
0.72(0.33-1.5) |
0.397 |
|
house wife |
Other occupation (Reference) |
5 |
22 |
1 |
1 |
|
House wife |
300 |
369 |
3.6* |
3.1(0.9-10.9) |
0.08 |
|
Educational status of husband |
Illiterate |
22 |
19 |
1.97 |
7.6(3.02-19.2) |
<0.000.1 |
Read and write |
133 |
117 |
1.9 |
1.7(1.039-2.8) |
0.035* |
|
Primary School and above (Reference) |
150 |
255 |
1 |
1 |
||
Educational status of Mother |
Illiterate |
67 |
55 |
2.1 |
1(0.514-1.9) |
0.999 |
Read and write |
138 |
164 |
1.45 |
1.7(0.99-2.9) |
0.051 |
|
Primary School and above (Reference) |
100 |
172 |
1 |
1 |
||
The child still breastfeeding |
No |
128 |
125 |
1.54* |
1.5(0.99-2.4) |
0.055 |
Yes (Reference) |
177 |
266 |
1 |
1 |
||
Child Feeding Index terciles |
Low child feeding index |
141 |
67 |
2.4* |
3.3(1.9-5.8) |
<0.000.1 |
Average child feeding index (Reference) |
98 |
114 |
1 |
1 |
||
Good child feeding |
66 |
210 |
0.4* |
0.45(0.27-0.75) |
0.002* |
|
Number of < 5 years children in the house (mean ± SD) (1.74 ± 0.5) |
305 |
391 |
1.2 |
0.76(0.49-1.2) |
0.219 |
|
Number of PNC visit (mean±SD)(1.85±1.2) |
305 |
391 |
0.4* |
0.38(0.31-0.47) |
<0.000.1 |
|
*significant at 0.05 |
||||||
Underweight |
||||||
Yes |
No |
COR |
AOR(95% C.I. for AOR) |
P. value |
||
Child Feeding Index terciles |
Low child feeding index |
56 |
152 |
2.1* |
2.4(1.39-4.2) |
0.002* |
Average child feeding index (Reference) |
32 |
180 |
1 |
|||
Good child feeding |
22 |
254 |
0.5* |
0.42(0.23-0.78) |
0.006* |
|
Educational status of Mother |
Illiterate |
10 |
112 |
0.85 |
0.57(0.25-1.3) |
0.167 |
Read and write |
74 |
228 |
3.1 |
2.6(1.5-4.4) |
0.001* |
|
Primary School and above(Reference) |
26 |
246 |
1 |
1 |
||
Age of child |
6-11 month age (Reference) |
36 |
305 |
1 |
1 |
|
12-23 month age |
74 |
281 |
2.2* |
2.04(1.26-3.3) |
0.004* |
|
Sex of child |
Male |
71 |
298 |
1.8 |
1.63(1.01-2.6) |
0.042* |
Female (Reference) |
39 |
288 |
1 |
1 |
||
Number of < 5 children in the house(mean±SD) (1.74±0.5) |
110 |
586 |
4.8* |
3.6(2.03-6.4) |
<0.000.1 |
|
Number of PNC visits (mean±SD) |
110 |
586 |
0.8* |
0.95(0.78-1.2) |
0.598 |
|
*significant at 0.05 |
||||||
Yes |
No |
COR |
AOR(95% C.I. for AOR) |
P. value |
||
|
||||||
Child Feeding Index terciles |
Low child feeding index |
10 |
198 |
1.02 |
0.44(0.15-1.3) |
0.141 |
Average child feeding index (Reference) |
10 |
202 |
1 |
|||
Good child feeding |
4 |
272 |
0.29* |
0.4(0.12-1.3) |
0.119 |
|
Diarrheal attack in the last 2 weeks |
No (Reference) |
12 |
555 |
1 |
||
Yes |
12 |
117 |
4.7* |
3.4(1.2-9.9) |
.024* |
|
Number of < 5 children in the house (mean ± SD) (1.74 ± 0.5) |
24 |
672 |
2.74* |
2.45(1.06-5.6) |
.036* |
|
Number of ANC visits (mean ± SD) (2.5 ± 1.5) |
24 |
672 |
0.76* |
0.99(0.7-1.36) |
0.961 |
|
Age of child in a month (mean ± SD)(13.2 ± 5.3) |
24 |
672 |
1.1* |
1.06(0.98-1.15) |
0.168 |
|
Age of mother in a year (mean ± SD)(28.4 ± 4.4) |
24 |
672 |
0.9* |
0.86(0.77-0.96) |
.009* |
|
*significant at 0.05 |
||||||
The prevalence of stunting (43.8%) was high in the sample as compared to national prevalence (40%) and nearly equal to SNNPR’s prevalence (44.1%). Butunder weight and wasting prevalence (15.8% and 3.45%) respectively were low as compared to the national and SNNPR. The distribution of all three indicators of under nutrition were getting worse when age increase. Which were similar findings as the previous studies in our country [1, 5].
To assess child feeding practices by summary index of key infant and child feeding practices (composite variable), internal consistency of seven items (components) was checked. For all age groups, when all 7 (seven) items of the index were included in the reliability analysis, the value of the Cronbach’s α coefficient was 0.584. Which was below acceptable range (≤0.70) [21]. But removing current breast feeding from the reliability analysis increased the Cronbach’s α coefficient to the acceptable range, which was 0.705. The correlation of current breast feeding with the total summary index for all age groups as well as for each age group was also very weak and negative [Table5]. Therefore, as mentioned earlier in the result part, to create child feeding index, current breasting score was removed from the index creation and treated as another independent variable in the model. The correlation of dietary diversity, meal frequency and 7 days food frequency were strong and positive for 6-8months and 9-11 months age infants, whereas for 12-23 months age children only meal frequency and 7 days food frequency were strongly and positively correlated, dietary diversity was moderately correlated for this age group. This means that the number of food groups given to a child was not increasing while the age of children increase.
The mean IYCFI score for 6-8 months age-group (6.53) was the highest as compared to other age groups whereas mean IYCFI score for 9--11 months old infants (5.48) was the lowest scores. In general, for all age groups, mean child feeing index score is not satisfactory because it is almost half of the maximum value of ten (10) [table5]. This indicates more gaps in the child feeding practices among all age groups. Decreasing of IYCFI score when age increase in the present study is not consistent with the findings of the study done in rural India which reported child-feeding index score increase with age increase [22]. The reason of inconsistency might be, majority of 6-8 months age children introduced complementary food as compared to the Indian infants. Only nine infants started complementary food at 6 months of their age. In this study, however, majority of infants started complementary food; it was not adequate when the age of children increase. Black et al. reported that even with optimum breastfeeding, children will become stunted if they do not receive an adequate quantity and quality of complementary foods after six months of age [8]. Our findings are in line with the report by Black et al. The micronutrient and energy source components of the index, i.e. seven days food frequency, dietary diversity and meal frequency mean score for 9-11 month and 12-23 months age groups were relatively poor whereas the stunting, underweight and wasting prevalence were high among them.
The distribution of children by their feeding index terciles for the children was 29.9% of children fell in to poor infant and child feeding practice while 39.9% of them were fell in to good infant and child feeding practice [figure6]. The result reflected that feeding practices of the majority mothers were not optimal for the children. The analysis of feeding index terciles in relation to age groups showed that most of the infants 92(47.5%) in the youngest age group (6–8 months) were found in the good infant and child feeding practice and 93(26.2%) of children among the oldest age group (12-23 months age) were found in the poor infant and child feeding practice [figure7]. This high prevalence of poor feeding practices for 9-11 months and 12- 23 months age group may be attributed to the high prevalence of under-nutrition in these age groups. The result of multiple logistic regression analysis of this study also showed that being older age (12-23 months) was significantly associated with stunting and underweight (P < 0.001).
In sum, in the current study, even though breast feeding practice removed from the index creation because of its internal inconsistency with other components, the younger children (6-8 months) were more likely to be fed better than the older ones (12-23 months), and this may be because they are perceived to be very vulnerable or weak and therefore in need of more attention compared to older children who may be regarded as strong enough to feed on the adult diet and according to adult meal frequency.
In the sampled children of this study, the complementary feeding practices which were identified to be undesirable were bottle feeding practice, no introduction of complementary feeding for few children in each age group, and no feeding of flesh food group (meat, poultry, and organ meats) to their children. These undesirable feeding practices also contributed to the low mean score of infant and child feeding index.
In this study, the association between feeding index terciles and stunting and underweight by multivariate logistic regression analysis after adjusting the potential confounders showed that low feeding index tercile and high feeding index tercile were positively and negatively respectively associated with both stunting and underweight as compared to medium feeding index [table7-8]. There was no any association between wasting and feeding index terciles in this study [table 8].Wasting prevalence was very low in this study; it might be the reason for no association with IYCFI. Studies in Ethiopia, Latin America and Burkina Faso reported that infant and child feeding index was a predictor of HAZ and WAZ score [13, 23, 24, 25] (23,24,25,13). The studies done in India, Garg et al. reported association between child feeding index score and under nutrition [22] whereas Srivastava et al. failed to find so [26].
The result of current study showed that children belonged to poor feeding practice (low feeding index tercile) 2.4 times more likely to be underweighted as compared to children belonged to medium feeding practice (medium feeding index tercile) whereas children belonged to good child feeding practice (high feeding index tercile) 55% less likely to be stunted as compared to children belonged to medium child feeding practices. This indicated that the composite of feeding practices improve the nutritional status of children. This finding is similar with the study done in West Bengal, India, the finding on that study was Per unit increase in standardized IYCF score, under nutrition by all three indicators was likely to be reduced by 2-3% and the association was significant after adjustment for the potential confounders [27]. The finding of this study contradicts the findings of a study in urban settings of Ethiopia [28]where the composite index was unable to show an impact on nutritional status in the multivariate model.
However, many factors in bivariate analysis were significantly associated with under-nutrition; few were significantly associated with under nutrition in multivariate analysis.
The result of the present study indicated that child’s age is determinant factors of stunting and the risk of stunting increases with age. The finding of this study showed that children in the age group12-23 months were at significantly higher risk of stunting compared with children in the youngest age category (≤ 8months). This result is consistent with other studies in Ethiopia [1, 6, 29]. This needs attention since particularly stunting is associated not only with poor physical growth but also affects cognitive abilities that are irreversible after 2 years of age. For nutritional interventions also, children younger than 24 months of age responded much more rapidly to the improvement than older children. After a child reaches 2 years of age, it is very difficult to reverse stunting that has occurred earlier [7].
Mothers did not attend any formal school was positively and significantly associated with stunting as compared to mothers attended formal education whereas mothers who had more frequent visit of PNC clinic was significantly reduce the odds of being stunting. This result is consistent with the studies done in Arbaminch and Kamba Woreda Southern Ethiopia [3, 4]
Being male child, older age child (12-23 months age) and high number of under five children in the house were significantly associated with underweight.
In this study, a high prevalence of wasting was observed among children who had diarrhea in the two weeks before the survey as compared to children who had no diarrhea and its incidence is positively associated with wasting. This result is consistent with the studies done in West Gojam Zone and Somali region of our country, Ethiopia[29,30]. High number of under five children in the house were also positively and significantly associated with wasting as compared to low number of children.
In general, a number of interrelated maternal, child and household characteristics and morbidities of diarrhea, cough and fever were known to be associated with feeding practices and nutritional status of 6-23 months age children. Significant negative association of good infant and child feeding practice and significant positive association of poor infant and young child practice with undernutrition particularly stunting and underweight among 6-23 months age children after adjusting for other related factors highlighted their crucial role in child nutrition.
Therefore, improving of all feeding practices simultaneously is crucial to tackle the markedly increasing under nutrition rate when the age of children increased. Decision makers and program implementers had better evaluate the nutrition interventions that are being carried out at grass root level as IYCF guidelines. Demba Gofa District health office and other stakeholders should strengthen Behavior Change Communication (BCC) on complementary feeding practices Health workers and health extension workers should educate mothers on complementary feeding by emphasizing the importance of increasing consistency and variety of food, increasing meal frequency when the of age child increase
First, I would like to thank the Almighty God for providing me with good health and wisdom to be able to go through my MSc. Study successfully. Secondly, I would like to thank my advisors, Mr. Dessalegn Tamiru and Mr. Amanuel Tesfay, for their invaluable guidance and advises in all aspect of my thesis work. Thirdly, I would like to thank Demba Gofa District administration office and health sector for their provision of full time for MSc study and financial supports. Fourthly, I would like to thank all study participants for their full participation and time for this study.
- Central Statistical Agency[Ethiopia]. Ethiopia Mini Demographic and Health Survey. Addis Ababa, Ethiopia; 2014.
- UNICEF. The cost of hunger in Ethiopia. The social and economic impact of child undernourishment in Ethiopia summary report. Addis Ababa. 2014.
- Agedew E, Chane T. Prevalence of Stunting among Children Aged 6 – 23 Months in Kemba Woreda , Southern Ethiopia : A Community Based Cross-Sectional Study. Adv Public Heal. 2015;2015.
- Jisha H, Tamiru D. Dietary Patterns and Anthropometric Status of Under-Five Children in Arba Minch Zuria, Gamo Gofa Zone: Community-Based Cross-Sectional Study. J Adv Dairy Res. 2015;3(138). DOI: 10.4172/2329-888X.1000138
- Moshago D, Gibson RS, Abebe Y. Assessment of the Nutritional Adequacy of Complementary Foods and Infant and Young Child Feeding Practices in Sodo Zurea District , Wolayita , Southern Ethiopia. 2016;30(Supp 1).
- Central Statistical Agency [Ethiopia] and ICF International. Ethiopia Demographic and Health Survey 2011. Addis Ababa, Ethiopia and Calverton, Maryland, USA: Central Statistical Agency and ICF International. 2012.
- Martorell R, Khan LK, Schroeder DG. Reversibility of stunting: epidemiological findings in children from developing countries. Eur J Clin Nutr. 1994;48(1):S45–57.
- Black RE, Allen LH, Bhutta ZA, Caulfiel LE, Onis M de, Ezzati M, et al. Maternal and child undernutrition : global and regional exposures and health consequences. Lancet Ser. 2008;371(9608):243-260. doi: 10.1016/S0140-6736(07)61690-0.
- Victora CG, Adair L, Fall C, Hallal PC, Martorell R, Richter L, et al. Maternal and Child Undernutrition 2 Maternal and child undernutrition : consequences for adult health and human capital. Lancet Ser. 2008;371(9609):340-357. doi: 10.1016/S0140-6736(07)61692-4.
- Bhutta ZA, Das JK, Rizvi A, Gaff MF, Walker N, Horton S, et al. Evidence-based interventions for improvement of maternal and child nutrition : what can be done and at what cost ? Lancet Ser. 2013;382(9890):452-477.
- Gatahun EA, Abate MG, Abyu DM. Current complementary feeding practice among 6-23 months young children, kemaba woreda south ethiopia. IJFST. 2016;6(1):1–10.
- Regassa N. Infant and child feeding practices among farming communities in Southern Ethiopia. 2014;16(4):215–222.
- Haile D, Belachew T, Birhanu G, Setegn T, Biadgilign S. Infant feeding practices among HIV exposed infants using summary index in Sidama Zone , Southern Ethiopia : a cross sectional study. BMC Pediatrics. 2014;14(1):1–9.
- Demba Gofa District Health sector. Demba
- Demba Gofa Agricuture sector. Demba Gofa District Agriculture sector report of 2016. 2016.
- Golden M, Brennan M, Brennan R, Kaiser R, Seaman J. Measuring Mortality, Nutritional Status, and Food Security in Crisis Situations: SMART METHODOLOGY. 2006;1–129.
- Arimond M, Ruel MT. Generating Indicators of Appropriate Feeding of Children 6 through 23 months from the KPC 2000+. Washington DC: FANTA / AED; 2003.
- Ruel MT, Menon P. Creating a Child Feeding Index Using the Demographic and Health Surveys: An Example from Latin America. Washington, DC: International Food Policy Research Institute. 2002.
- Arimond M, Ruel MT. Progress In Developing An Infant And Child Feeding Index: An Example Using The Ethiopia Demographic And Health Survey 2000.Fcnd Discussion Paper No.143. Washington, DC: International Food Policy Research Institute (IFPRI). 2002;143.
- Tavakol M DR.Making sense of Cronbach ’s alpha. Int J Med Ed. 2011;2:53–55. doi:10.5116/ijme.4dfb.8dfd
- Tavakol M, Dennick R. Making sense of Cronbach’s alpha. 2011;2:53–55. doi:10.5116/ijme.4dfb.8dfd
- Garg A, Chadha R. Index for Measuring the Quality of Complementary Feeding Practices in Rural India. 2009;27(6):763–771.
- Arimond M, Ruel MT. Summary Indicators for Infant and Child Feeding Practices: An Example from the Ethiopia Demographic and Health Survey 2000. Washington, D.C: Food and Nutrition Technical Assistance Project, Academy for Educational Development. 2002.
- Ruel MT, Menon P. Child Feeding Practices Are Associated with Child Nutritional Status in Latin America : Innovative Uses of the Demographic and Health Surveys. J Nutr. 2002;132(6):1180–1187.
- Sawadogo PS, Martin-Prevel Y, Savy M, Kameli Y, Traissac P, Traore AS, et al. An Infant and Child Feeding Index Is Associated with the Nutritional Status of 6- to 23-Month-Old Children in Rural Burkina Faso. J Nutr. 2006;136(3):656–663.
- Srivastava N, Sandhu A. Index for Measuring Child Feeding Practices. Indian J Pediatr. 2007;74(4):363–368.
- Mukhopadhyay DK, Sinhababu A, Saren AB, Biswas AB. Association of Child Feeding Practices with Nutritional Status of Under-two Slum Dwelling Children : A Community-based Study from West Bengal , India. Indian J Public Heal. 2013;57(3):169–172. doi: 10.4103/0019-557X.119819.
- Arimond M, Ruel MT. Progress In Developing An Infant And Child Feeding Index: An Example Using The Ethiopia Demographic And Health Survey 2000. Washington, DC: International Food Policy Research Institute (IFPRI). 2002.
- Teshome B, Kogi-makau W, Getahun Z, Taye G. Magnitude and determinants of stunting in children under- five years of age in food surplus region of Ethiopia : The case of West Gojam Zone. Ethiop J Heal Dev. 2009;23(2):98–106. DOI: 10.4314/ejhd.v23i2.53223
- Fekadu Y, Mesfin A, Haile D, Stoecker BJ. Factors associated with nutritional status of infants and young children in Somali Region , Ethiopia : a cross-sectional study. BMC Public Health. 2015;1–9. DOI:10.1186/s12889-015-2190-7

